How to analyse P2
Protocol 2 analysis
The data from Protocol 2 is processed using the function process_protocol2(). This function runs the complete analysis pipeline including bar sweep analysis, flash receptive field analysis, and bar flash analysis.
Step-by-step
Navigate to the experiment folder in MATLAB:
cd('C:\matlabroot\G4_Protocols\nested_RF_protocol2\data\YYYY_MM_DD_HH_MM')Replace
YYYY_MM_DD_HH_MMwith the timestamp of your experiment folder.Run the analysis:
process_protocol2()
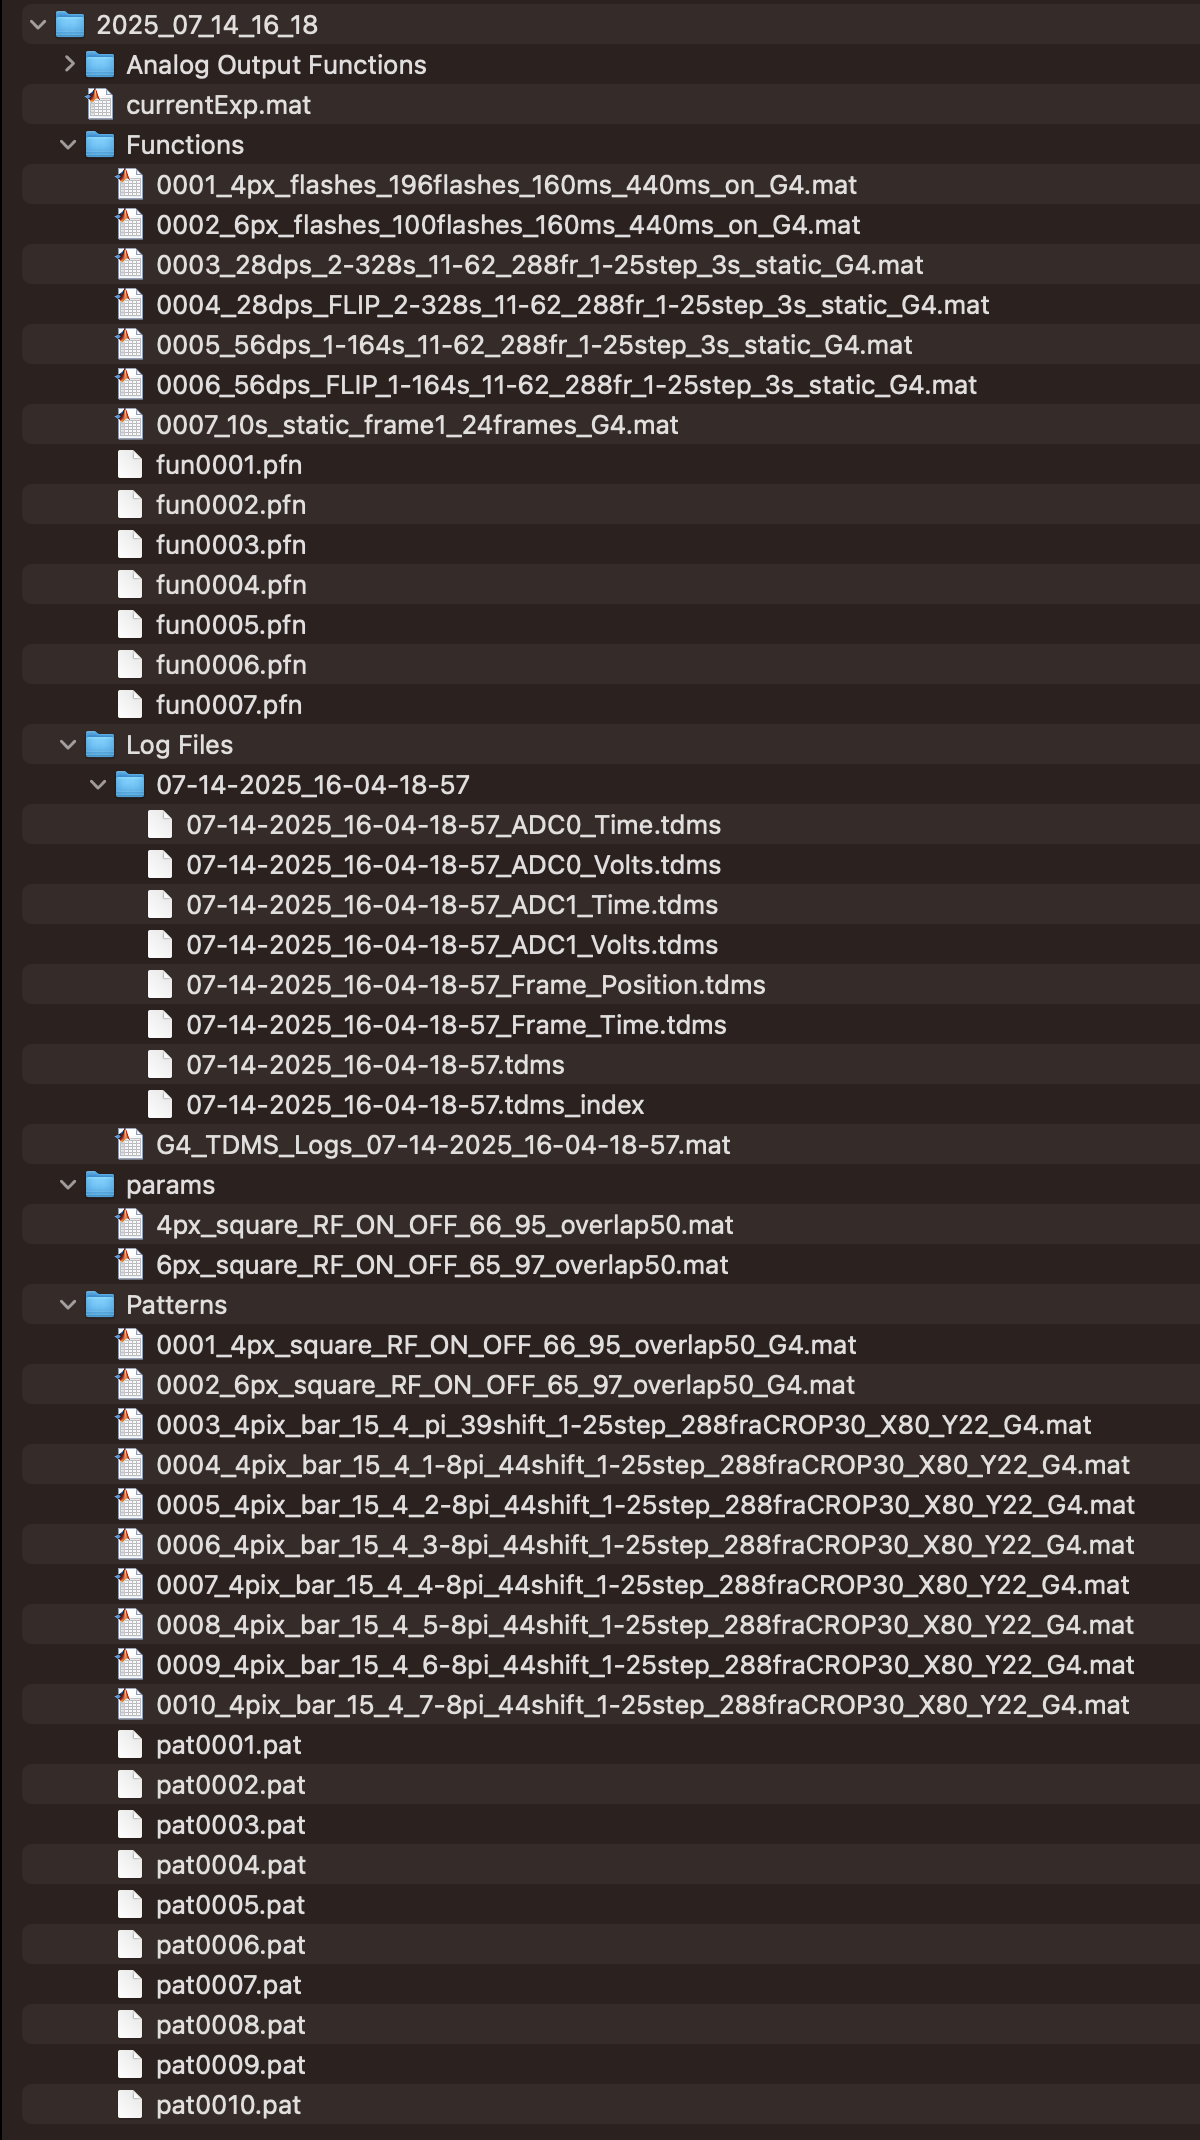
You must cd into the experiment folder before calling process_protocol2(). The function expects to find the Log Files/, Patterns/, Functions/, and params/ subfolders in the current working directory.
What the function does
process_protocol2() runs three analysis stages in sequence:
Load data:
load_protocol2_data()reads the TDMS log files, extracts voltage and frame position data, and loads experiment metadata and stimulus parameters.Bar sweep analysis:
process_bars_p2()analyses the responses to moving bars in 16 directions. This produces:- Polar plots of directional responses
- Vector sum calculation to determine the preferred direction
- Direction selectivity metrics (DSI, circular variance, FWHM, von Mises parameters)
The resultant angle (preferred direction) from this analysis is passed to the flash analysis below.
Flash analysis:
process_flash_p2()analyses the receptive field using flash responses. It produces:- Spatial heatmaps of excitatory and inhibitory responses
- 2D Gaussian fits to the RF lobes
- An arrow overlay showing the preferred direction from the bar analysis
Bar flash analysis (if bar flash stimuli were presented):
process_bar_flashes_p2()analyses the responses to stationary bar flashes at different positions and orientations.
The bar sweep analysis must run before the flash analysis because the preferred direction calculated from bar responses is overlaid on the receptive field plots.
Analysis outputs
The analysis generates figures and saves results to the following locations:
| Output | Location | Description |
|---|---|---|
| Bar results | results/bar_results/peak_vals_<strain>_<on_off>_<date>.mat |
Direction selectivity metrics, polar plot data |
| Flash results | results/flash_results/rf_results_<date>_<time>_<strain>_<on_off>.mat |
RF heatmap data, Gaussian fit parameters |
| Bar figures | figures/bar_stimuli/baselineb4/ |
Polar plots, timeseries, heatmaps |
| Flash figures | figures/flash_stimuli/ |
RF heatmaps, Gaussian fit plots |
The PROJECT_ROOT variable in process_protocol2.m determines where results and figures are saved. If you are running this on a different computer, you may need to update this path. See Installation & Setup for details.
How the data is organised
- Each run of
generate_protocol2()creates a new folder withinC:\matlabroot\G4_Protocols\nested_RF_protocol2with the formatYYYY_MM_DD_HH_MMof the date and time when the protocol was run. - Within this folder there will be a
Patterns/folder with the patterns that were used, aFunctions/folder with the position functions, and aparams/folder containing parameter files for each stimulus type. - The
Log Files/folder contains a subfolder with the exact date and time of the run that holds the raw TDMS files. At the end ofrun_protocol2(), the functionG4_TDMS_folder2struct()from G4_Display_Tools converts the TDMS files into a combined MATLAB structure calledLog.
Further reading
For detailed breakdowns of each analysis component, see:
- Bar sweep analysis — parsing, plotting, and metrics for moving bar responses
- Flash RF analysis — parsing, heatmaps, and Gaussian fitting for flash responses
- Bar flash analysis — analysis of stationary bar flash responses
- Interpreting results — how to understand and evaluate the analysis outputs