Trajectory Viewer
The Trajectory Viewer is a standalone HTML page for interactively exploring individual fly trajectories from freely-walking optomotor experiments. It can be opened locally in any modern browser with no server or software dependencies, making it easy to share with collaborators.
What the viewer shows
For each fly, the viewer displays:
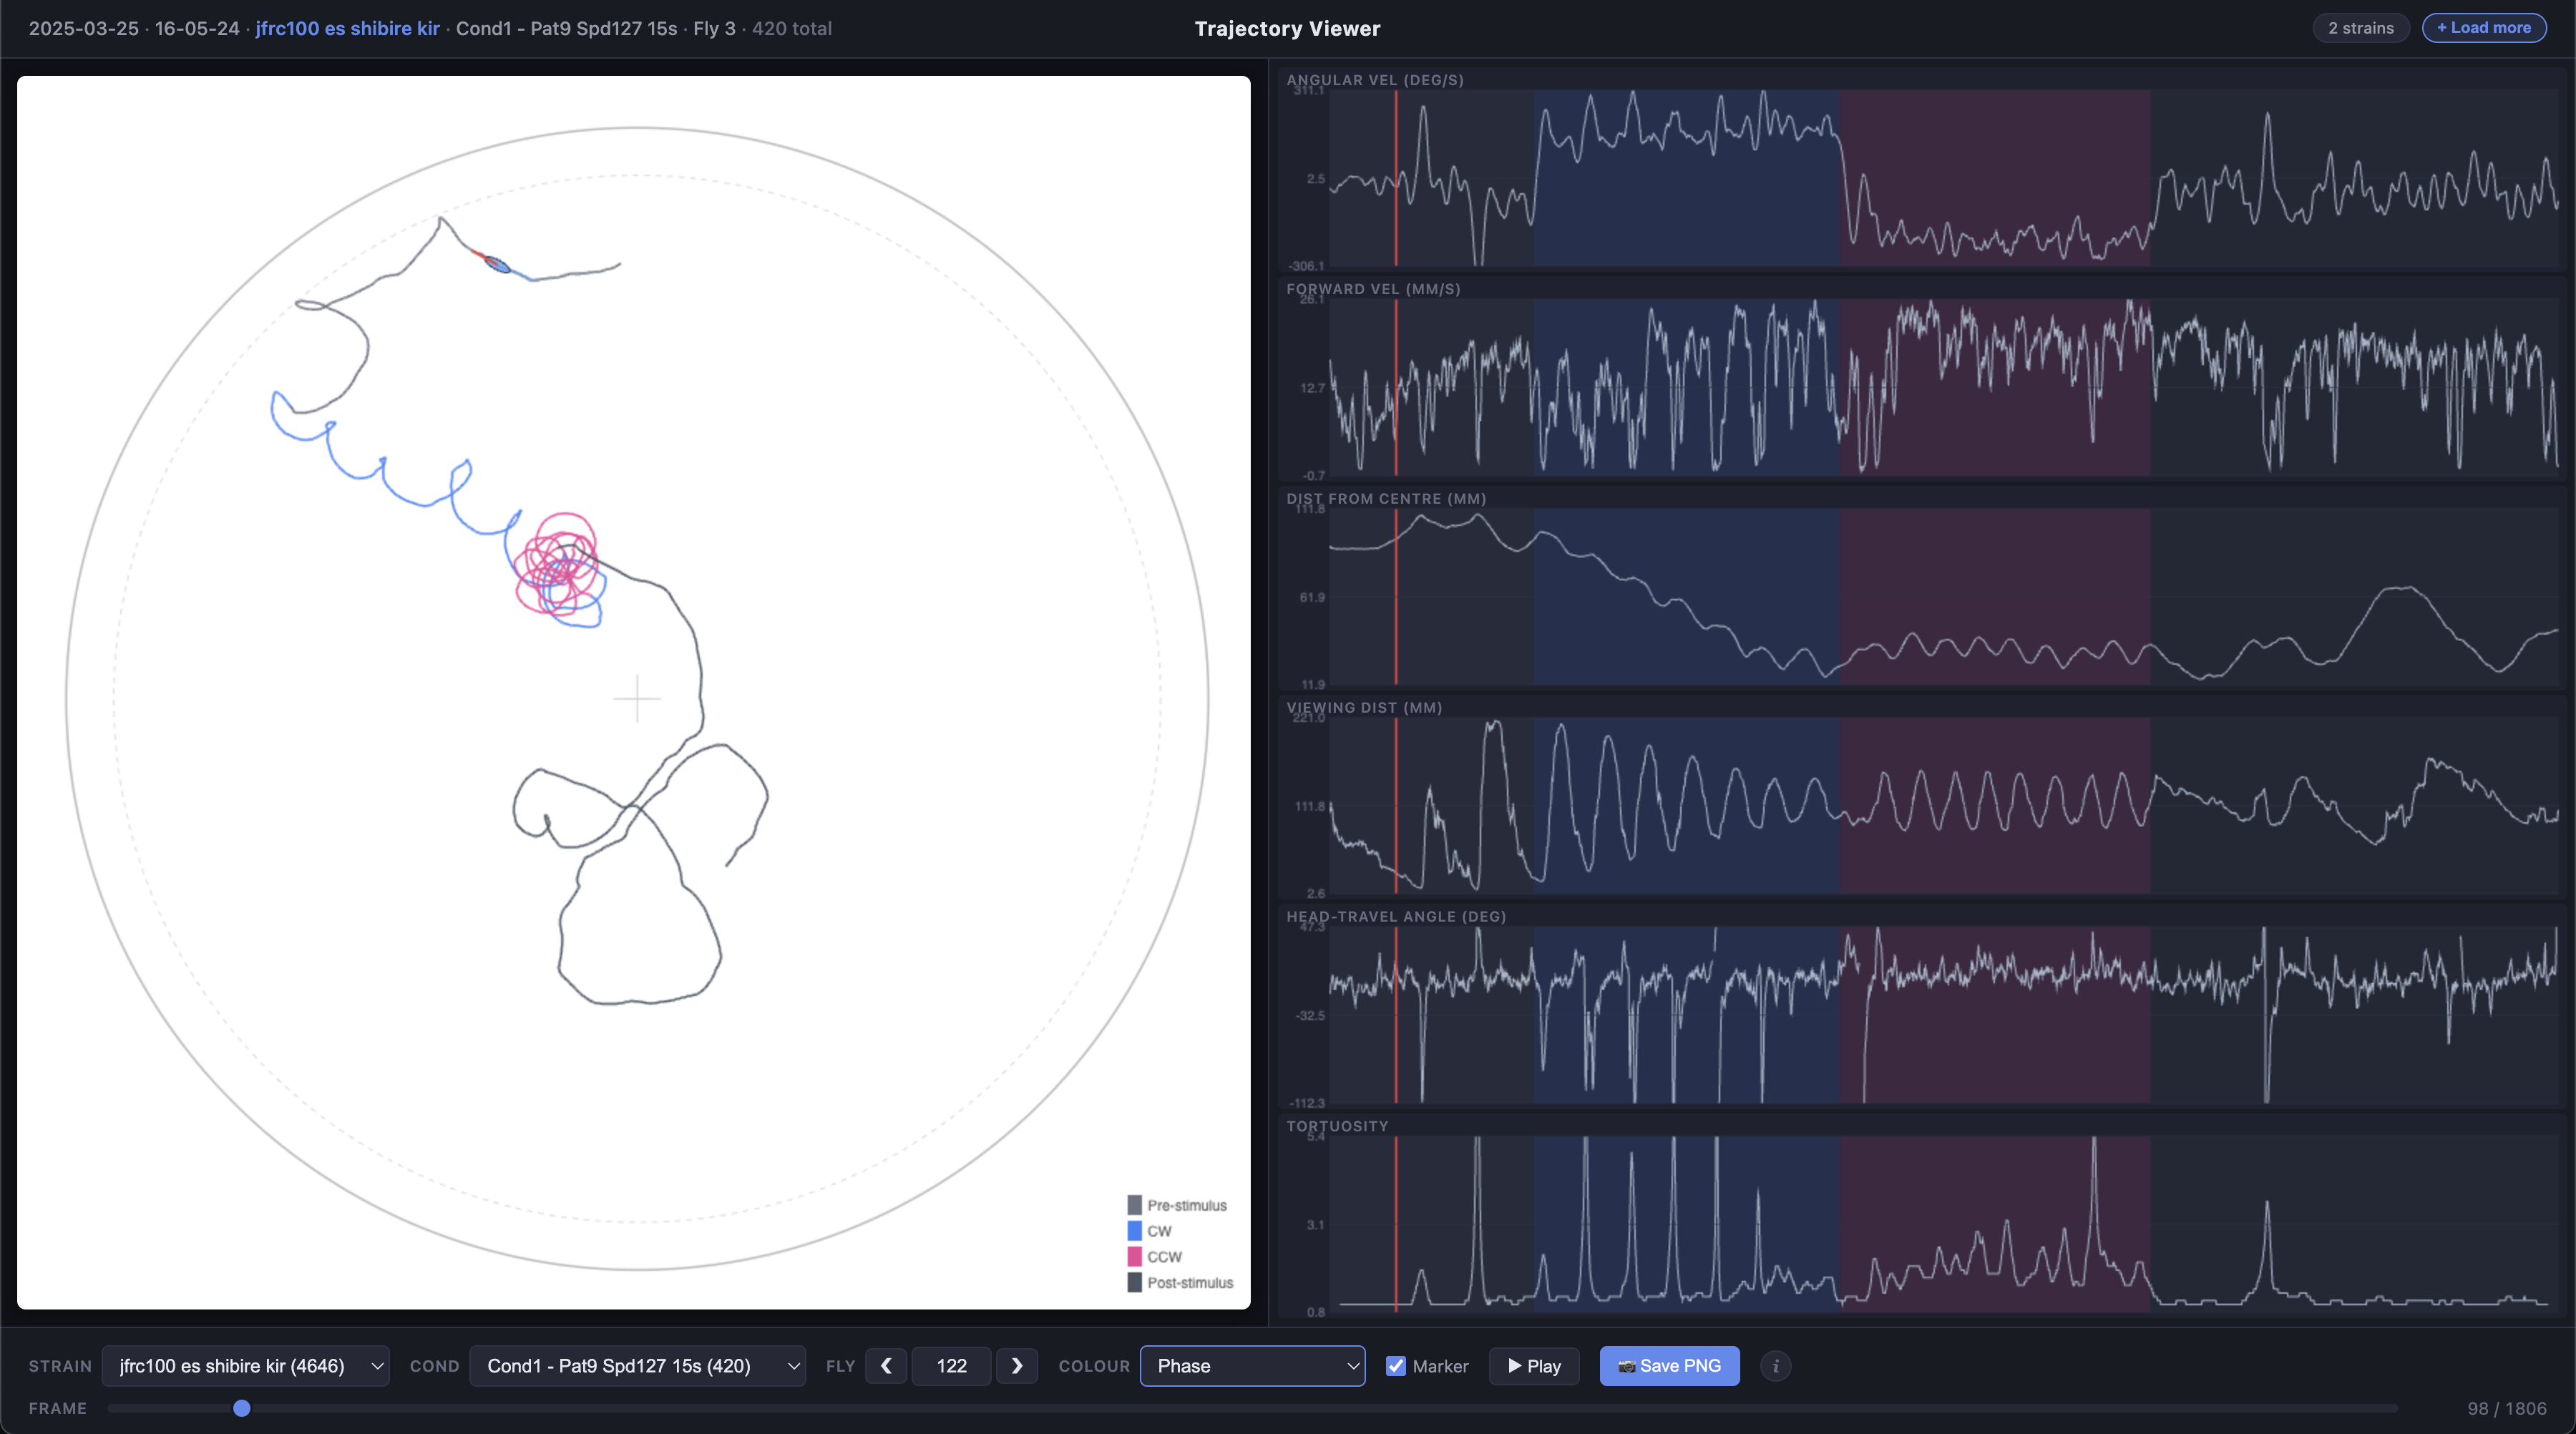
- Trajectory plot (main panel) — the fly’s x/y path inside the arena, with an optional animated ellipse marker showing body orientation and heading
- Time series plots (right panel) — angular velocity, forward velocity, distance from centre, viewing distance, heading-vs-travel angle difference, and tortuosity, all synchronised to the same frame slider
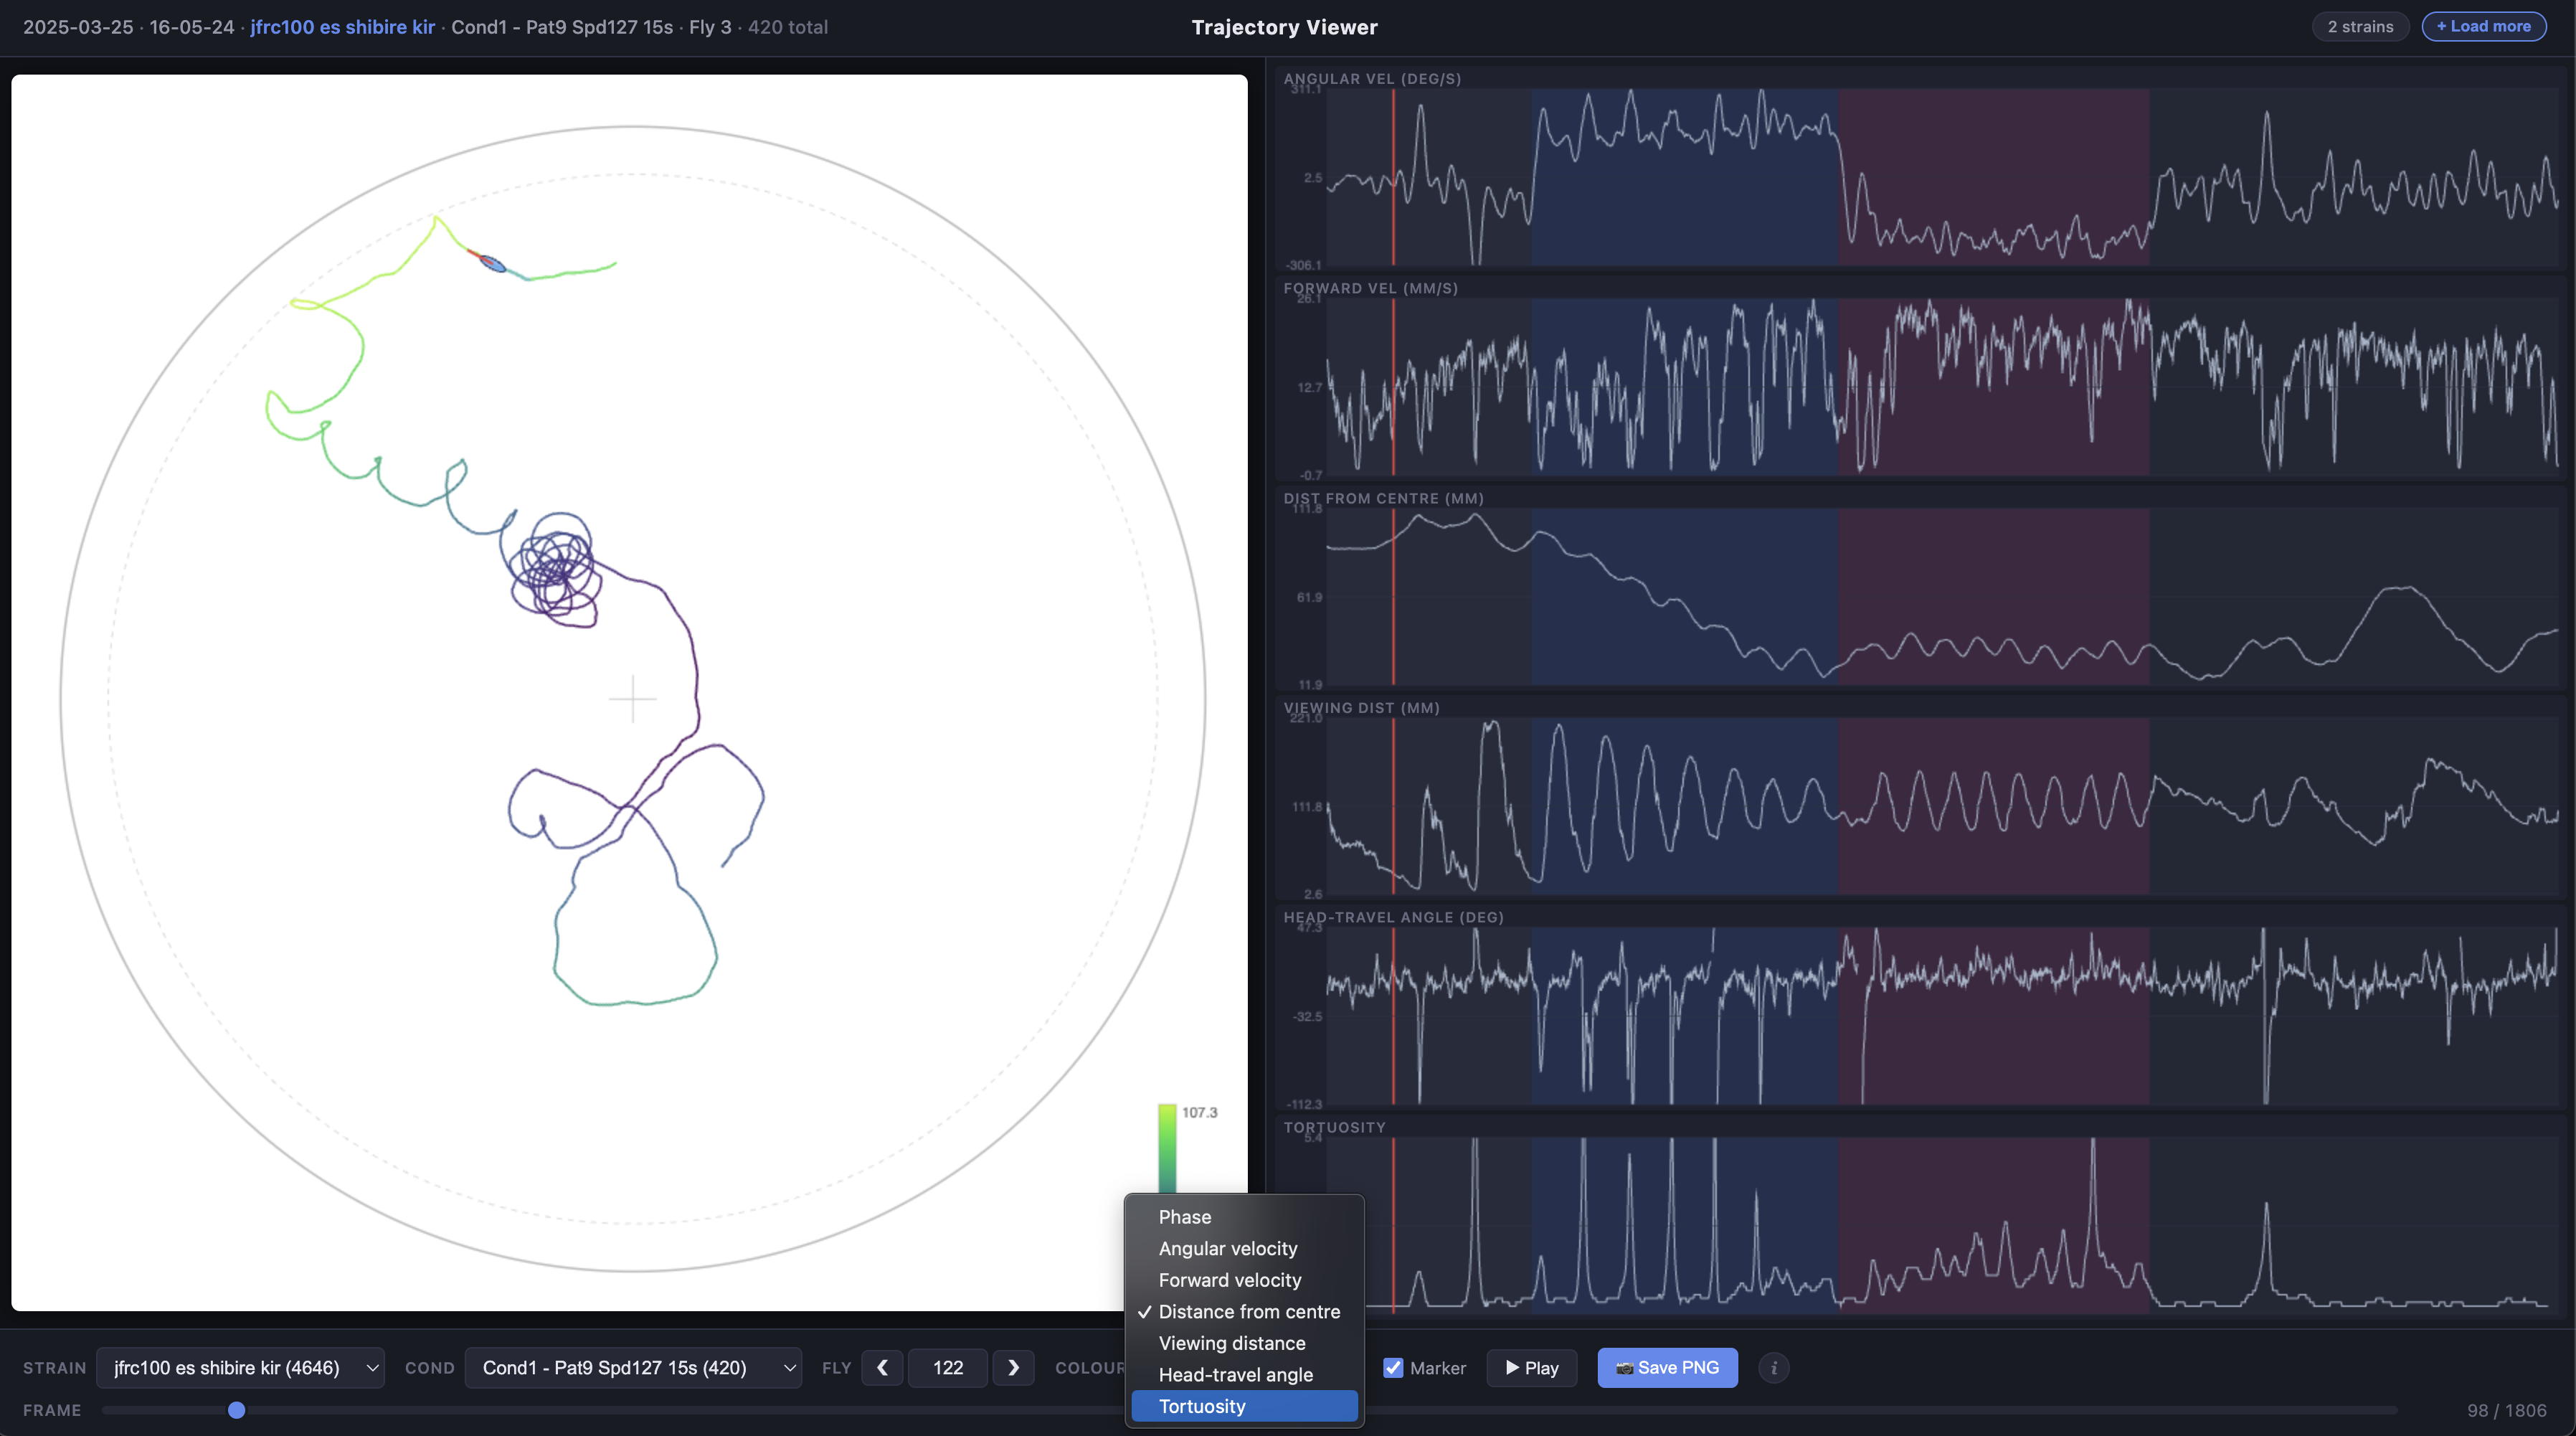
The trajectory line can be coloured by experimental phase (pre-stimulus, CW, CCW, post-stimulus) or by any of the time series metrics using a viridis colour scale.
Prerequisites
- The freely-walking-optomotor repository cloned locally
- MATLAB with the repository on the path (
setup_path) - Processed
DATAstruct fromcomb_data_across_cohorts_cond
Generating data files
The MATLAB function export_trajectory_data produces a set of lightweight JSON files (one per strain per condition) and an empty HTML viewer page.
Basic usage
cfg = get_config();
setup_path;

% Load processed data for a protocol
DATA = comb_data_across_cohorts_cond(fullfile(cfg.results, 'protocol_27'));

% Export all strains and conditions
export_trajectory_data(DATA);
This creates:
~/Documents/Projects/oaky_cokey/html_files/trajectories/
├── trajectory_viewer.html     (empty viewer, ~50 KB)
└── data/
    ├── ss00096_Dm4_shibire_kir_cond1.json
    ├── ss00096_Dm4_shibire_kir_cond2.json
    ├── ss02784_TmY3_shibire_kir_cond1.json
    └── ...
Filtering exports
Use name-value pairs to export a subset of strains or conditions:
% Export only strains containing "Dm4" or "TmY3", conditions 1-3
export_trajectory_data(DATA, ...
    'Strains', {'Dm4', 'TmY3'}, ...
    'Conditions', [1 2 3]);
The Strains parameter does substring matching (case-insensitive), so 'Dm4' will match any strain name containing that string.
All parameters
| Parameter | Default | Description |
|---|---|---|
OutputDir |
~/Documents/Projects/ oaky_cokey/html_files/ trajectories |
Output directory for JSON files and viewer HTML |
Sex |
'F' |
Sex filter: 'F', 'M', or 'both' |
Strains |
{} (all) |
Cell array of substring filters for strain names |
Conditions |
[] (all) |
Numeric array of condition indices to include |
Reps |
1 |
Which repetitions to include: 1, 2, or [1 2] |
IncludeAcclim |
false |
Include acclimation phase conditions |
TortuosityWindow |
31 |
Window size in frames (~1 s at 30 fps) for tortuosity calculation |
Downsample |
1 |
Integer factor to reduce frame count (e.g., 2 keeps every other frame) |
MaxFliesPerStrain |
Inf |
Cap on flies per strain (useful for reducing file size) |
Re-exporting data
When data is reprocessed or new experiments are added, re-run the export to update the JSON files. The HTML viewer does not need to be regenerated unless the viewer code itself has been updated.
Using the viewer
Loading data
- Open
trajectory_viewer.htmlin a web browser - Click the Load JSON files button, or drag and drop
.jsonfiles onto the drop zone - Multiple files can be loaded at once — each adds its strains to the viewer
The viewer shows a badge indicating how many strains are currently loaded.

Controls
| Control | Description |
|---|---|
| Strain | Filter dropdown with substring matching — type to search (e.g., “Dm4”) |
| Condition | Select experimental condition from a dropdown. Labels show condition number, pattern, speed, duration, and fly count |
| Fly | Navigate between flies using < / > buttons or type a fly ID directly |
| Colour | Choose how the trajectory line is coloured: by condition phase, angular velocity, forward velocity, distance from centre, viewing distance, heading-travel angle, or tortuosity |
| Show marker | Toggle the animated ellipse marker (body + heading line) |
| Frame slider | Scrub through the trajectory frame by frame. A red cursor on the time series plots tracks the current frame |
| Play | Animate the marker through the trajectory |
Interacting with plots
Both the trajectory plot and time series plots support interactive zoom and pan:
- Scroll wheel to zoom in/out
- Click and drag to pan
- Double-click to reset to the default view
An ⓘ button in the viewer provides a tooltip reminder of these controls.
Time series metrics
Hover over each time series plot title for a tooltip describing how the metric is calculated:
| Metric | Description |
|---|---|
| Angular Vel (deg/s) | Rate of change of heading direction |
| Forward Vel (mm/s) | Speed in the heading direction |
| Dist from Centre (mm) | Euclidean distance from the fly to the arena centre |
| Viewing Dist (mm) | Distance from the fly to the arena wall along its heading direction (ray-circle intersection). Depends on both position and heading angle |
| Ang Diff Head-Travel (deg) | Absolute angular difference between heading and direction of travel (0° = moving in heading direction) |
| Tortuosity | Path tortuosity over a sliding window (~1 s): ratio of path length to displacement. Values near 1 indicate straight movement; higher values indicate more tortuous paths |
Phase colouring
When colour mode is set to Condition (phase), the trajectory and time series backgrounds are divided into four phases:
| Phase | Colour | Frames |
|---|---|---|
| Pre-stimulus | Grey | 0–299 |
| CW (clockwise) | Blue | 300–749 |
| CCW (counter-clockwise) | Pink | 750–1199 |
| Post-stimulus | Grey | 1200+ |
Frame boundaries may vary slightly depending on hardware timing pauses in the protocol.
Saving images
Click Save PNG to download the current trajectory plot as a PNG image. The filename automatically includes the date, time, strain, condition, and fly ID.