Processing Pipeline
This page describes the automated processing pipeline that handles data flow from the acquisition rig through tracking and MATLAB processing to final results on the network drive.
The processing pipeline generates a standalone HTML page that shows the current processing stage of every experiment. It is auto-regenerated whenever the pipeline updates an experiment’s status. See Pipeline status page below for details.
Overview
Three Python scripts automate data flow from the acquisition PC to processed results. The scripts run on two physical machines and communicate via a shared network drive. Each script monitors for new data, processes it, and advances it to the next pipeline stage.
ACQUISITION PC NETWORK DRIVE PROCESSING PC
(oaky-cokey/data/)
┌──────────────────┐
│ MATLAB experiment│
│ (.ufmf + LOG.mat)│
└────────┬─────────┘
v
┌──────────────────┐
│monitor_and_copy │
│ [acquired] │
│ [copied_to_net] ├──────> 0_unprocessed/
└──────────────────┘ │
│
└──────> ┌──────────────────┐
│monitor_and_track │
│ [tracked] │
1_tracked/ <───┤ │
└────────┬─────────┘
v
┌──────────────────┐
│daily_processing │
│ [processed] │
│ [synced_to_net] ├─┐
└──────────────────┘ │
v
2_processed/ <─────────────────────┘
exp_results/
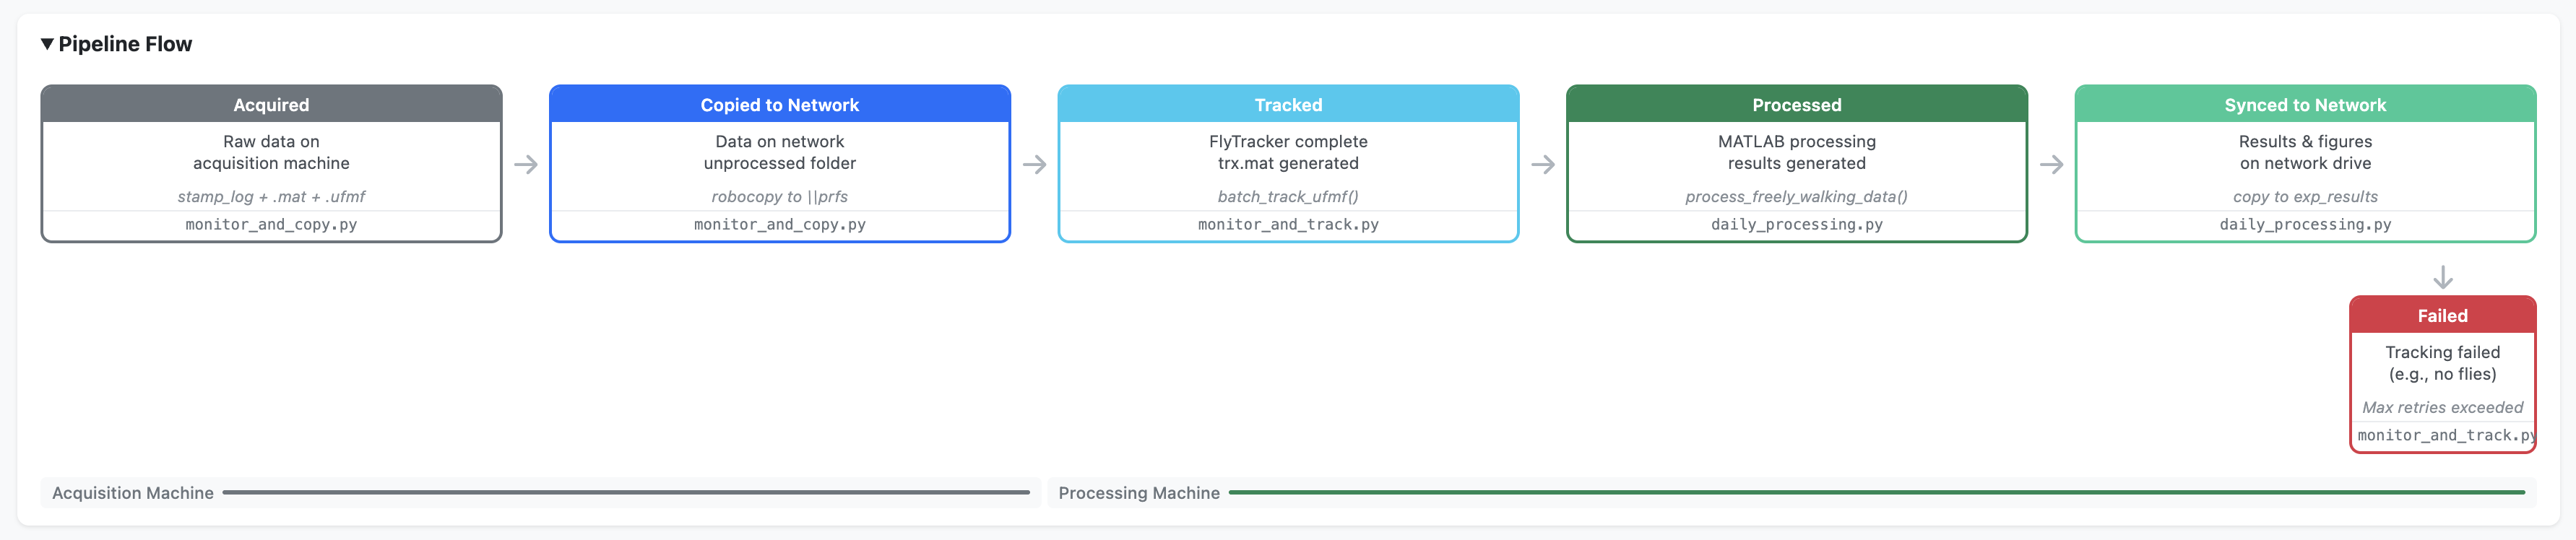
exp_figures/Pipeline stages
| Stage | Script | Machine | Description |
|---|---|---|---|
1. acquired |
monitor_and_copy.py |
Acquisition PC | Raw data detected on the rig |
2. copied_to_network |
monitor_and_copy.py |
Acquisition PC | Folder copied to network 0_unprocessed |
3. tracked |
monitor_and_track.py |
Processing PC | FlyTracker completed, trx.mat generated |
4. processed |
daily_processing.py |
Processing PC | MATLAB processing complete, results generated |
5. synced_to_network |
daily_processing.py |
Processing PC | Results, figures, and videos copied to network |
Network directory structure
All network directories reside on the Janelia network share at \\prfs.hhmi.org\reiserlab\oaky-cokey\.
| Directory | Contents | State |
|---|---|---|
data/0_unprocessed |
Raw experiment folders (.ufmf + LOG.mat + stamp_log) | Awaiting tracking |
data/1_tracked |
Tracked folders (+ trx.mat, feat.mat) | Awaiting processing |
data/2_processed |
Fully processed folders (+ MP4 videos) | Complete |
exp_results |
Result .mat files organised by protocol |
Analysis ready |
exp_figures/overview_figs |
Overview figures (PDF/PNG) | QC and review |
A folder is considered “complete” (ready to advance to the next stage) when it contains at least one .ufmf file, at least one .mat file, and a file whose name starts with stamp_log. This is checked by is_folder_complete() in the shared utilities module and ensures the experiment has finished writing all outputs before any copying or processing begins.
Experiment folder hierarchy
From September 25, 2024 onwards, experiment folders follow a structured hierarchy:
{date}/
  {protocol}/
    {strain}/
      {sex}/
        {time}/
          LOG_YYYY_MM_DD_HH_MM_SS.mat
          REC__cam_0_date_..._v001.ufmf
          stamp_log_cam0.txt
          pipeline_status.json          # added by pipeline
Earlier experiments (before September 25, 2024) use a flat {date}/{time}/ structure without intermediate metadata folders.
Pipeline scripts
Stage 1: Monitor and copy
monitor_and_copy.py runs on the acquisition PC. It uses the Python watchdog library to monitor the data folder (SOURCE_ROOT) for new experiment directories. When a new folder is detected, it is added to a pending set. Every 30 seconds, the script checks pending folders for completeness and copies complete folders to the network 0_unprocessed directory using shutil.copytree(), preserving the full folder hierarchy.
On startup, it also scans for any existing folders that may have been created while the script was not running, so experiments are never missed.
The script runs indefinitely until manually stopped. It is launched on login via run_monitor_and_copy.bat registered with Windows Task Scheduler.
Stage 2: Monitor and track
monitor_and_track.py runs on the processing PC. It polls the network 0_unprocessed directory every 5 minutes for new folders. For each untracked folder:
- Checks whether the folder has already been processed (exists in
1_trackedor2_processed) - Copies the folder locally to
DATA_UNPROCESSED(tracking over the network would be extremely slow) - Runs MATLAB FlyTracker in batch mode:
matlab -batch "batch_track_ufmf('<folder>')" - Verifies tracking success by checking for
trx.mat - Archives locally to
DATA_TRACKED - Moves the tracked data to
1_trackedon the network, deletes from0_unprocessed - Cleans up any empty parent directories left behind
CLI options:
run_monitor_and_track.bat                  # Default: exit after 75 min idle
run_monitor_and_track.bat --timeout 0      # Run indefinitely
run_monitor_and_track.bat --timeout 120    # Exit after 120 min idle
The --timeout flag controls how long the script waits (in minutes) with no new data before exiting. Default is 75 minutes (15 scan cycles × 5 minutes). Set to 0 to run indefinitely.
Stage 3: Daily processing
daily_processing.py runs once daily on the processing PC. It is a one-shot script (not a polling loop):
- Scans
DATA_TRACKEDfor date folders (YYYY_MM_DD) not yet inDATA_PROCESSED - For each new date, calls:
matlab -batch "process_freely_walking_data('YYYY_MM_DD')" - Copies result
.matfiles toexp_resultson the network (filtered by date prefix) - Copies overview figures (PDF/PNG) to
exp_figures/overview_figson the network - Moves the date folder from
DATA_TRACKEDtoDATA_PROCESSED(local and network) - Copies generated
.mp4stimulus videos to2_processedon the network
CLI options:
run_daily_processing.bat                              # Process new dates only
run_daily_processing.bat --reprocess                  # Reprocess ALL dates
run_daily_processing.bat --reprocess 2025_03_01       # Reprocess specific date(s)
The --reprocess flag forces reprocessing of dates that have already been processed. Without arguments it reprocesses all dates; with date arguments it reprocesses only those specific dates. This replaces the former standalone reprocessing_script.py.
Supporting scripts
| Script | Purpose |
|---|---|
copy_movies_to_network.py |
Backfill tool: syncs .mp4 video files from local DATA_PROCESSED to network 2_processed for experiments where videos were missed |
backfill_registry.py |
One-time utility to retroactively generate pipeline_status.json files and populate the global registry for pre-existing experiments |
generate_batch_files.py |
Auto-generates .bat launcher files from config.py paths. Run after changing Python or repo paths |
Status tracking system
The pipeline tracks every experiment’s progress through two complementary mechanisms: per-experiment status files and a global registry.
Per-experiment status
Each experiment folder contains a pipeline_status.json file that records which stages have been completed, when, and by which machine. This file is created when the experiment first enters the pipeline and updated at each stage.
{
  "experiment_id": "2025_02_26_14_30_00_jfrc100_es_protocol_27_F",
  "date": "2025_02_26",
  "protocol": "protocol_27",
  "strain": "jfrc100_es",
  "sex": "F",
  "time": "14_30_00",
  "stages": {
    "acquired": {
      "timestamp": "2025-02-26T14:31:00",
      "machine": "acquisition",
      "status": "complete"
    },
    "copied_to_network": { "..." : "..." },
    "tracked": { "..." : "..." }
  },
  "current_stage": "tracked",
  "errors": []
}
Global registry
A single pipeline_status.json file on the network drive aggregates the status of all experiments. It is updated atomically (via temp file + rename) by whichever machine completes a pipeline stage. The global registry drives the HTML status page and includes cross-reference fields indicating which machines have local copies of the data and results.
Pipeline status page
The automation scripts generate a standalone HTML page (pipeline_status.html) on the network drive that shows the processing stage of every experiment. It is auto-regenerated whenever the pipeline updates an experiment’s status.
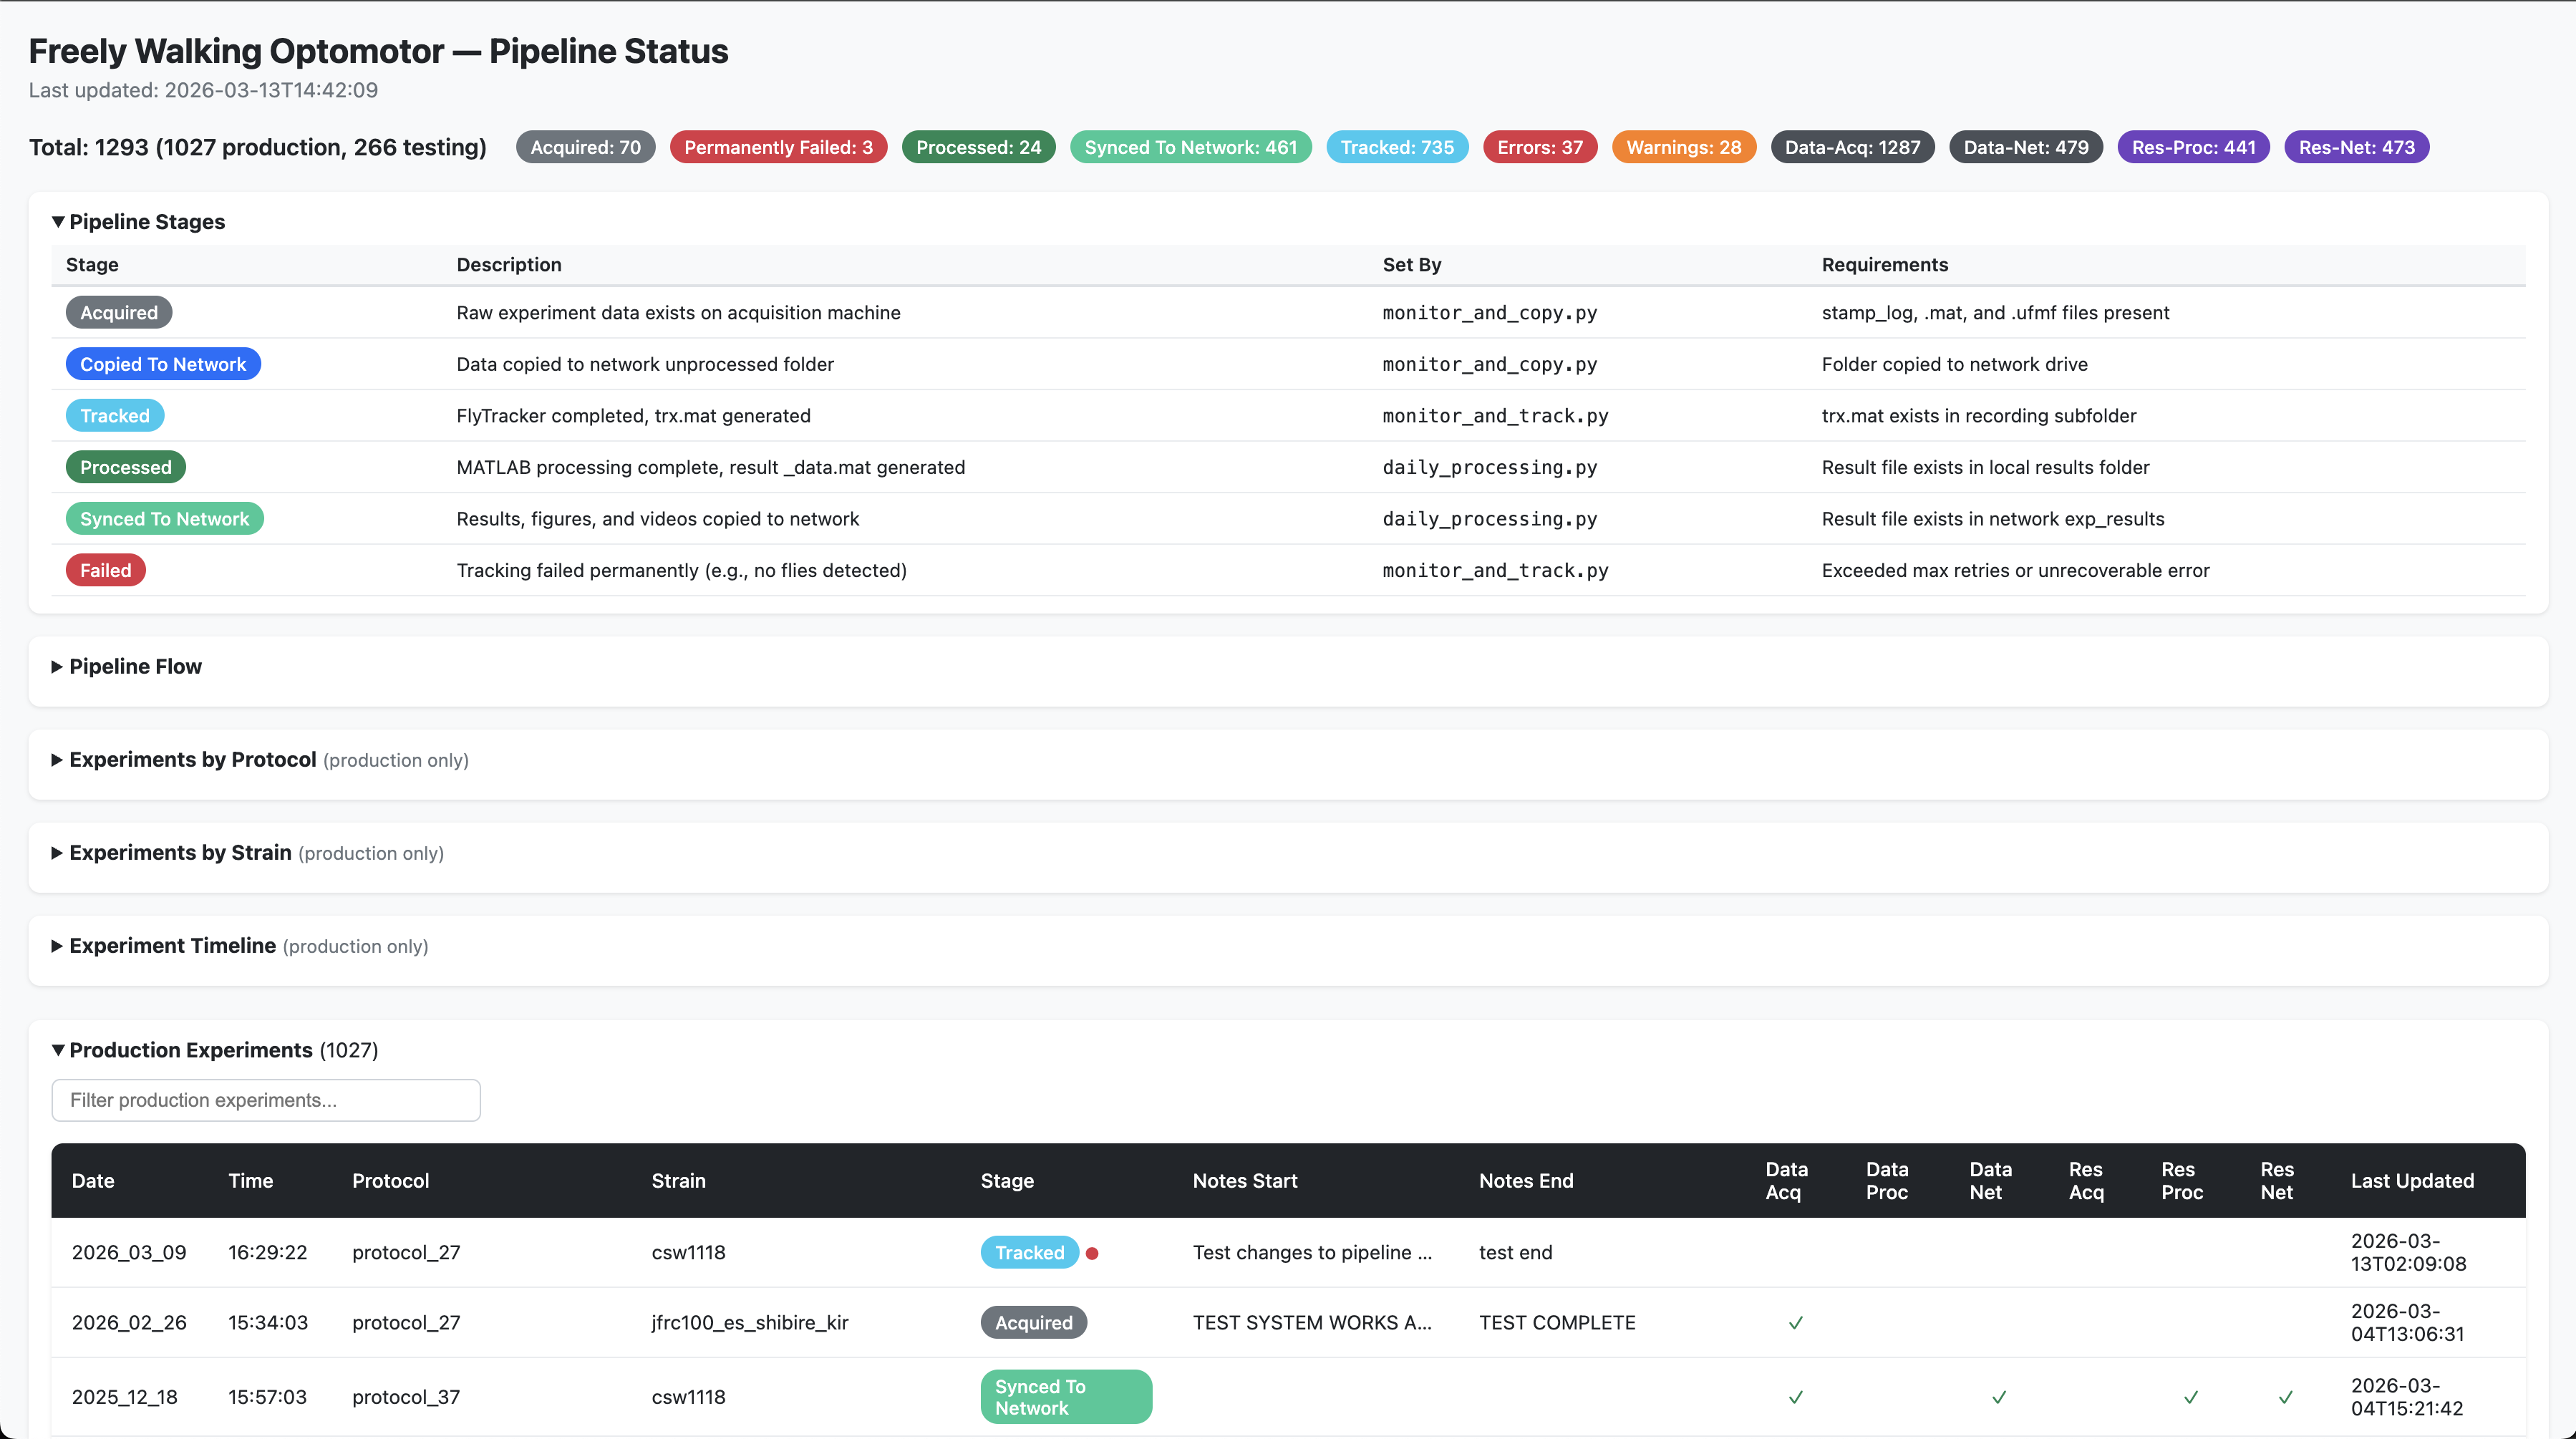
What it contains
- Sortable and filterable tables with colour-coded pipeline stages for each experiment
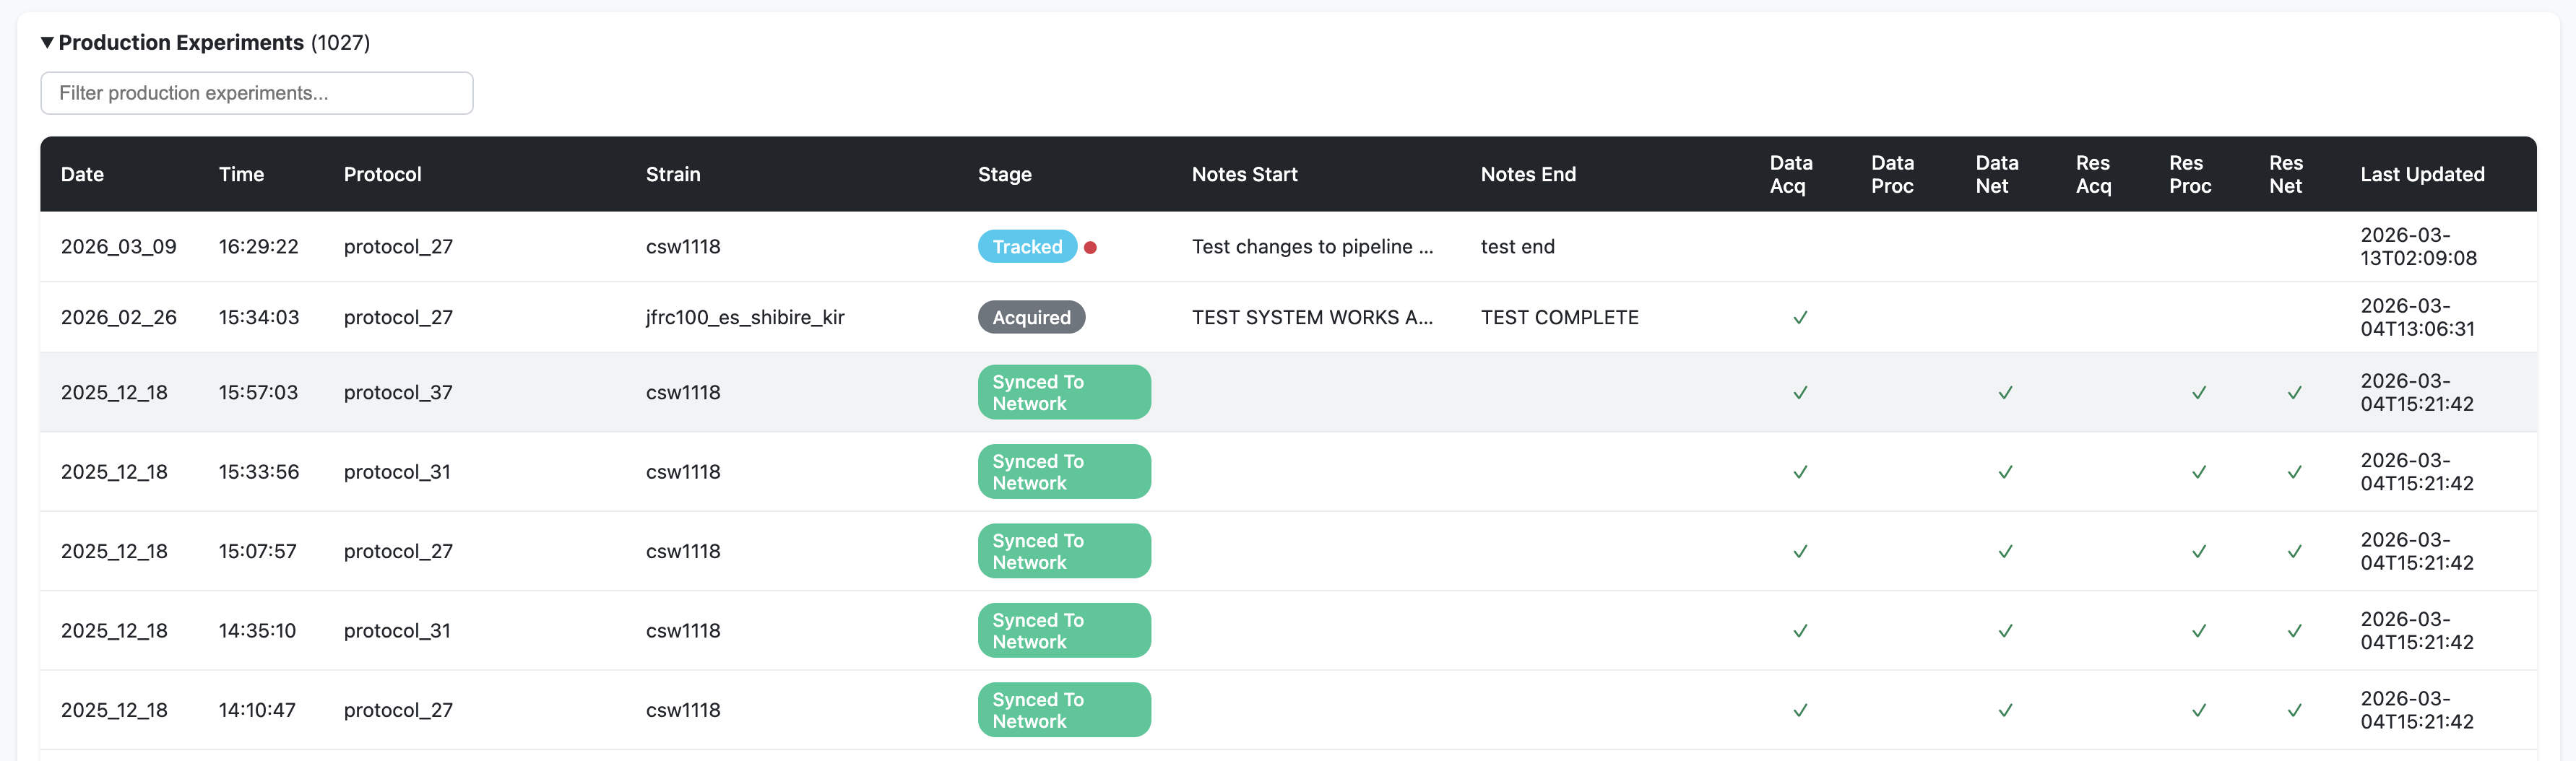
Cross-reference columns showing which machines hold copies of the data (Data Acq, Data Proc, Data Net) and results (Res Acq, Res Proc, Res Net)
Production experiments (from September 25, 2024 onwards) — displayed prominently with full metadata. An orange warning indicator (⚠) flags experiments with missing metadata or missing LOG files
Testing-phase experiments (before September 25, 2024) — collapsed by default. These older experiments have flat folder structures and “unknown” metadata is expected
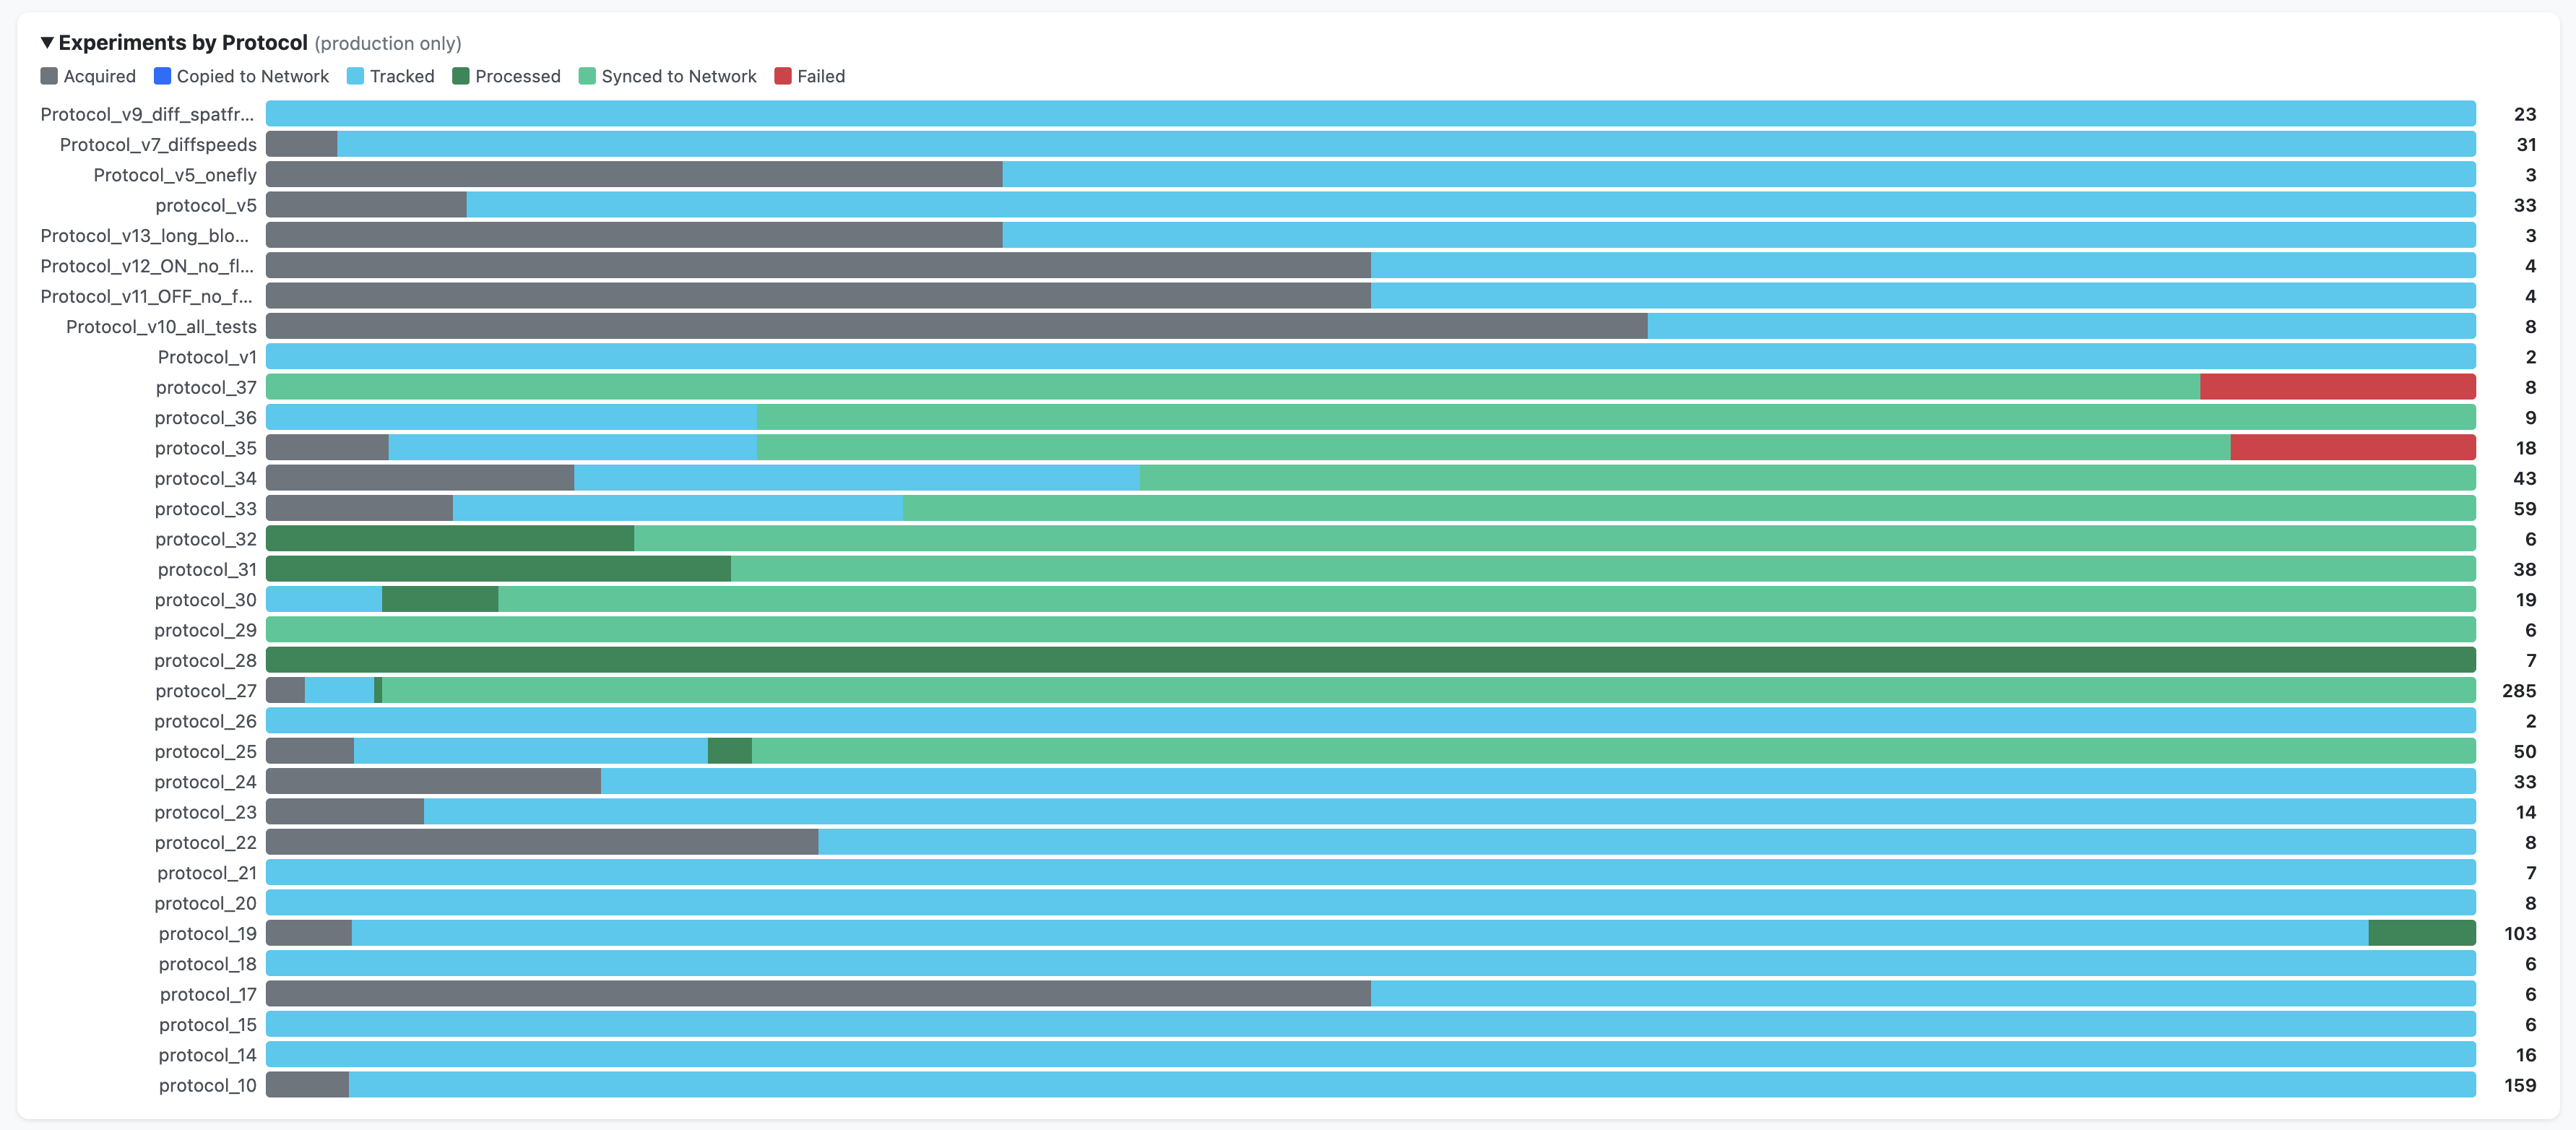
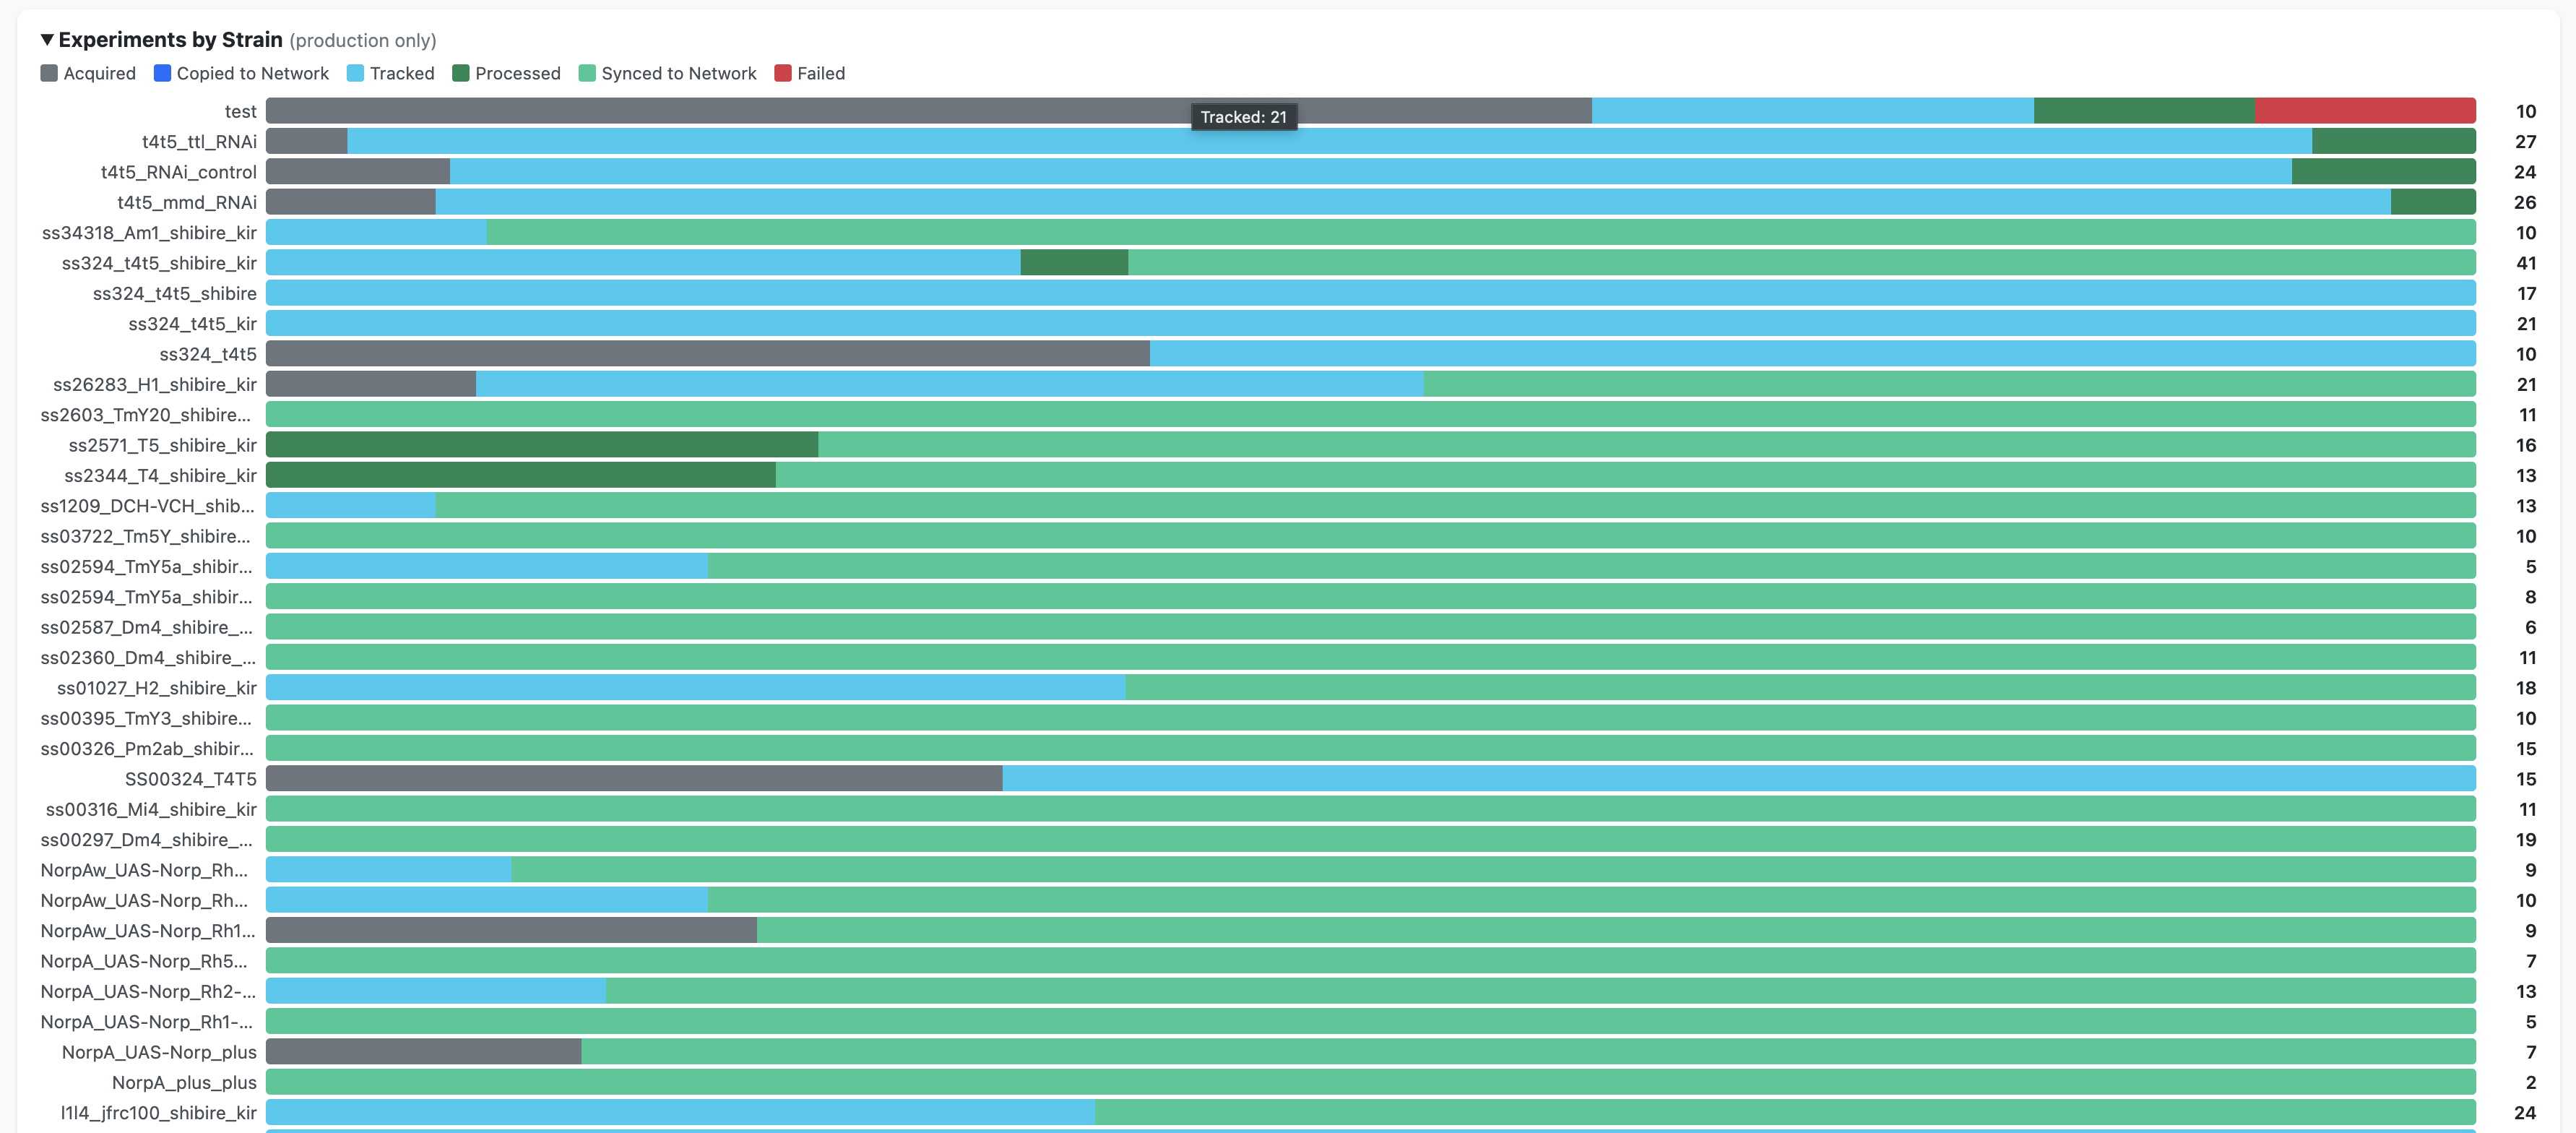
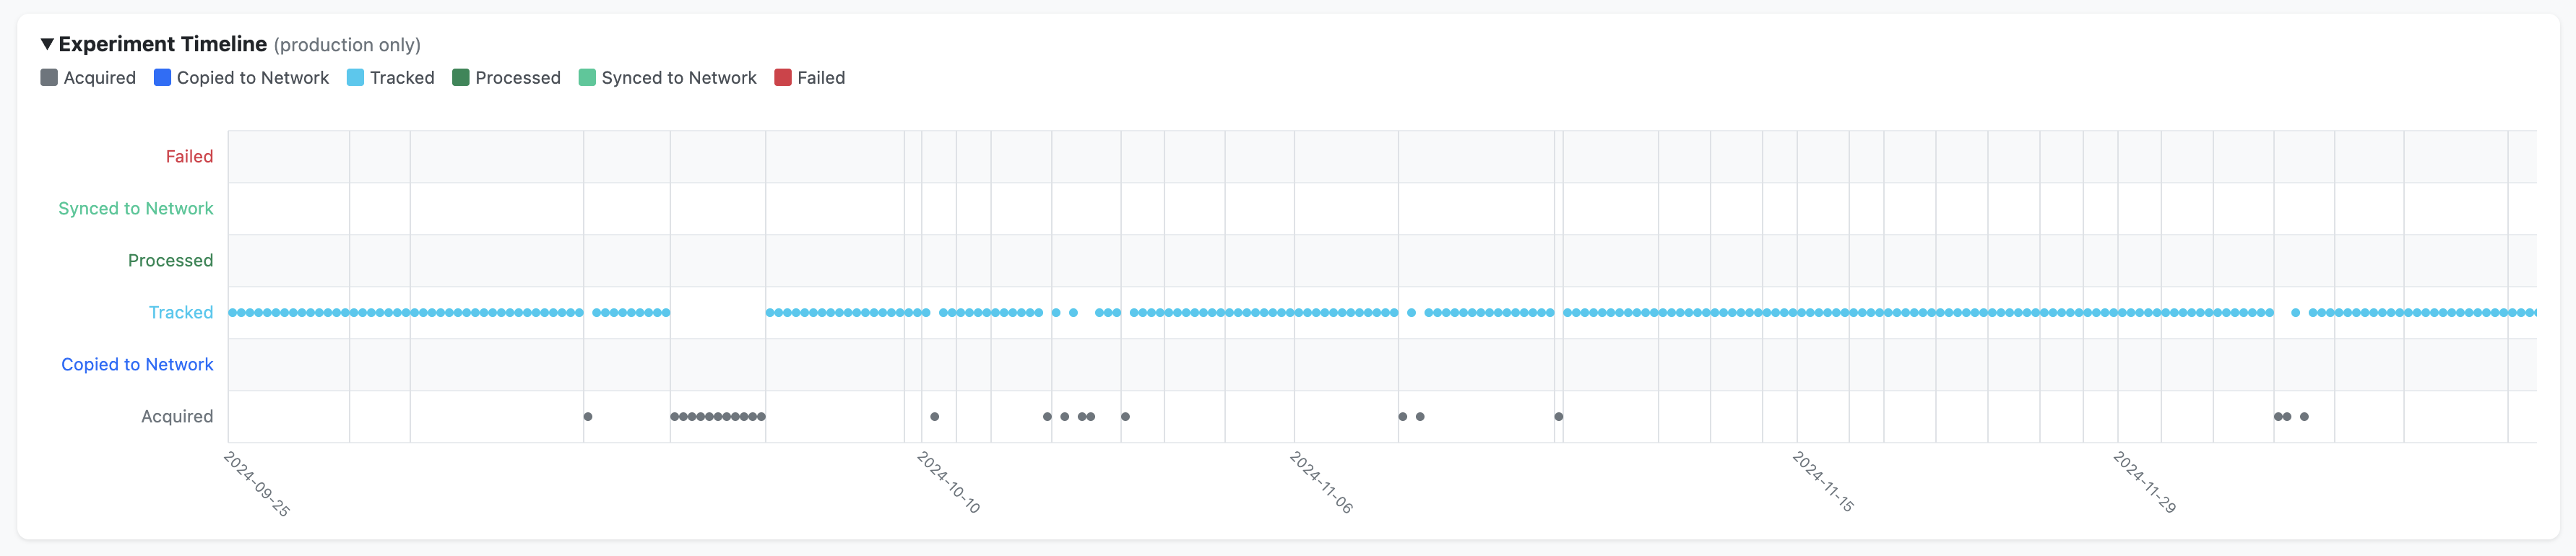
Summary charts — breakdowns by protocol, by strain, and a timeline view (production data only)
How it is generated
The status page is generated by generate_status_page() in python/automation/shared/registry.py. It is called automatically every time the pipeline updates an experiment’s status (i.e., after each call to update_registry()). The function reads the global registry JSON, computes summary statistics, and renders a self-contained HTML page with embedded JavaScript for sorting, filtering, and charting.
How to view it
The status page is saved to the network drive alongside the experiment data:
# macOS (requires the network drive to be mounted):
open /Volumes/reiserlab/oaky-cokey/pipeline_status.html

# Windows:
start \\prfs.hhmi.org\reiserlab\oaky-cokey\pipeline_status.html
Configuration
All path configuration is centralised in config/config.py within the freely-walking-optomotor repository. Each machine’s role is set once via the MACHINE_ROLE environment variable, and all other paths are derived automatically.
See the Configuration page for full details on path setup for each machine.
Machine roles
| Machine | MACHINE_ROLE |
Key paths |
|---|---|---|
| Acquisition PC | acquisition |
SOURCE_ROOT (where MATLAB/BIAS writes data), PROJECT_ROOT |
| Processing PC | processing |
PROJECT_ROOT (local data directories), MATLAB on PATH |
| Analysis machines | analysis (default) |
PROJECT_ROOT (optional, for dashboard/local analysis) |
Setting up the environment variable
On the two lab machines, the environment variable must be set once (admin terminal):
REM on the acquisition rig:
setx MACHINE_ROLE acquisition

REM on the processing machine:
setx MACHINE_ROLE processing
Analysis machines do not need any setup — the role defaults to analysis automatically.
Generating batch files
The .bat launcher files used by Windows Task Scheduler are auto-generated from config.py paths. After changing the Python executable path or repository location, regenerate them:
cd python\automation
python generate_batch_files.py
This creates three batch files (one per pipeline script) in their respective subdirectories.
Deployment
Machines
| Machine | Role | Scripts | Schedule |
|---|---|---|---|
| Acquisition PC | Runs experiments, captures video | monitor_and_copy.py |
Runs continuously (launched on login) |
| Processing PC | FlyTracker tracking, MATLAB processing | monitor_and_track.py |
Runs at scheduled times (Task Scheduler) |
| Processing PC | MATLAB processing, network sync | daily_processing.py |
Runs once daily (Task Scheduler) |
Setup checklist
Both machines:
Logs
Each script writes rotating log files to PROJECT_ROOT/logs/:
| Log file | Source |
|---|---|
monitor_and_copy.log |
Stage 1 script |
monitor_and_track.log |
Stage 2 script |
daily_processing.log |
Stage 3 script |
All automation scripts are located in python/automation/ within the freely-walking-optomotor repository.