Making sense of a fruit fly’s neural wiring diagram
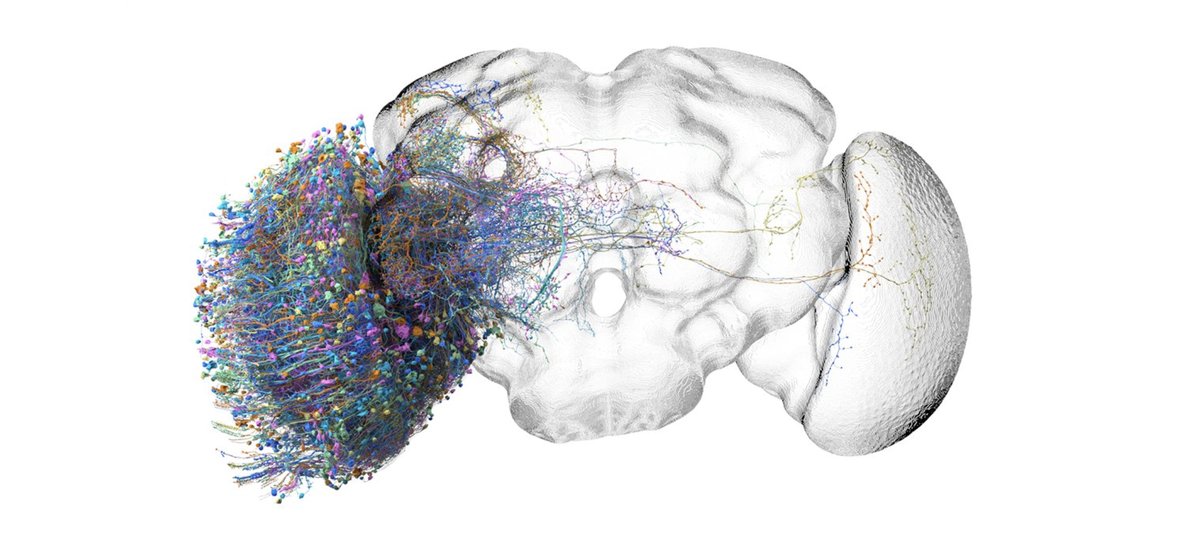
Visual system connectivity analysis and 3D visualisation of >50,000 neurons
Highlights
- Contributed to a shared codebase with 14 contributors, authoring and reviewing pull requests as part of the team’s review process.
- Helped release the analysis as an “executable paper”: Snakemake pipelines that build the 3D neuron renders, plus Jupyter notebooks that reproduce each figure from the source data.
- Wrote Cypher queries against a Neo4j graph database to analyse connectivity across 150,000+ neurons.
- Applied object-oriented design and the core Python data stack (pandas, Plotly) across the analysis code.
- Documented code for reuse by others: docstrings, READMEs and inline comments.
Background
Connectomes are extraordinary scientific resources.
They are comprehensive maps of all neural cells and their connections within an organism’s nervous system. These resources are made by creating many, many EM (electron microscopy) images of very thin sections of fixed tissue and then reconstructing them computationally back into a 3D representation.
Individual neurons and their connections are meticulously segmented and traced, by both machine learning algorithms and human annotators, to generate a complex database where each neuron and each connection has it’s own unique ID.
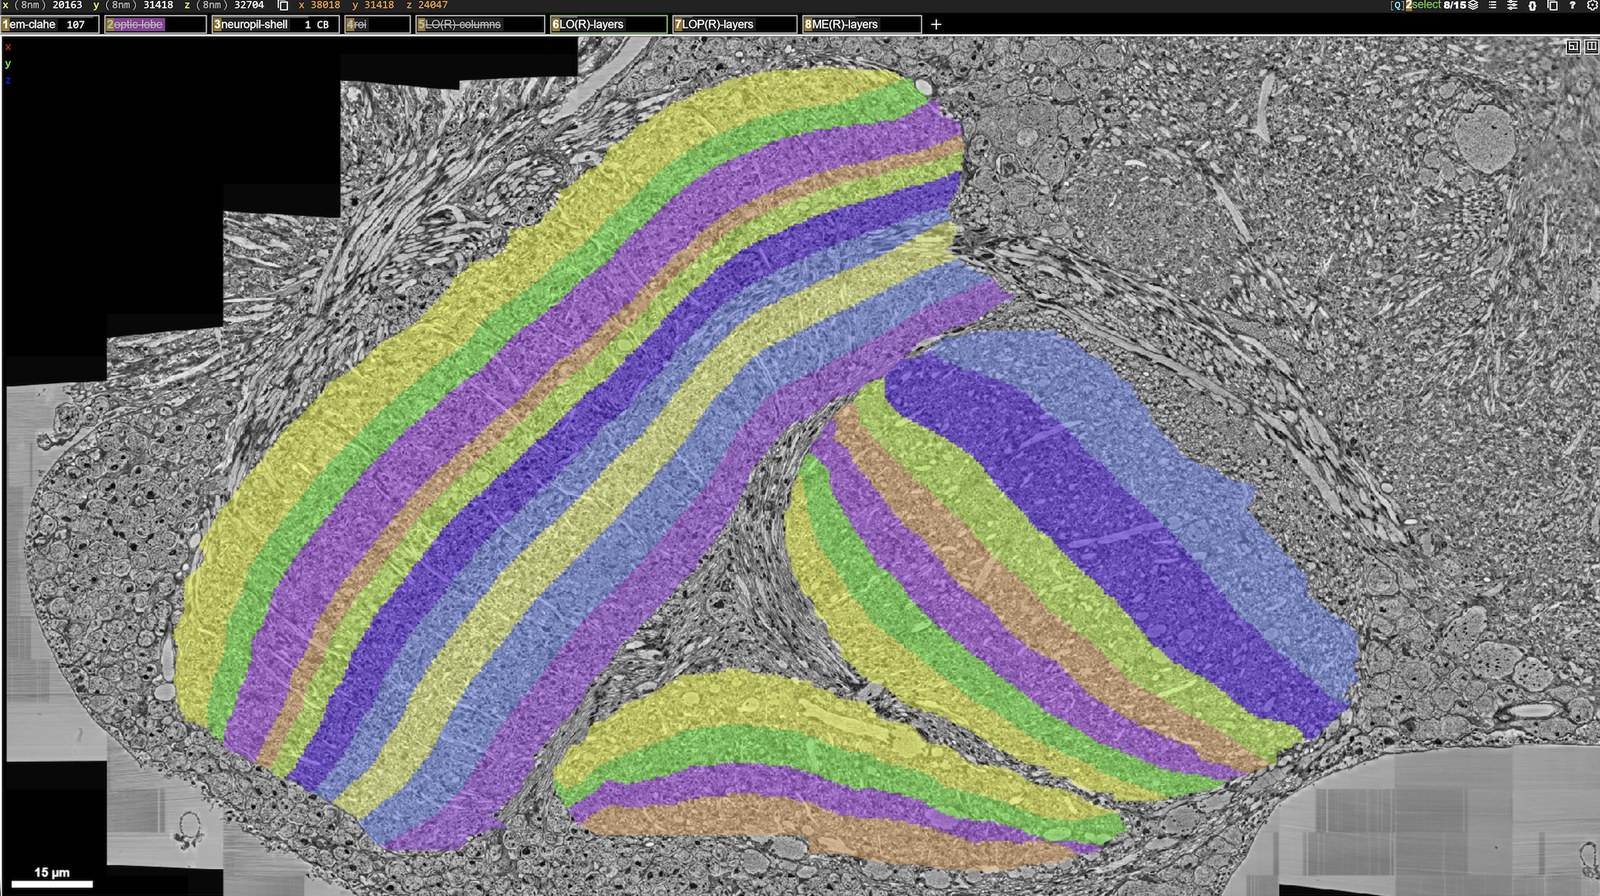
Since the generation of a single connectome requires vast amounts of time and resources, very few exist at the moment. The first connectome was of the soil-dwelling nematode worm Caenorhabditis elegans (C.elegans) which is only ~1mm long and contains only 302 neurons.
The nervous system of the fruit fly (Drosophila melanogaster) was an especially valuable candidate for connectome generation, since it is paired with nearly a century of deep genetic characterization, including a vast toolkit of mutants, genetic drivers, and functional data.
Combining this genetic knowledge with a complete wiring diagram allows researchers to link neural structure directly to gene expression and circuit function, turning the connectome into a resource not just for observing the nervous system, but for testing how it actually works.
Problem
Transform this dense database of connectivity data on an individual cell level into meaningful insights about the visual system of the fruit fly, primarily through the categorisation of cells into types.
Methods
The project involved querying a graphical database (neo4j) of ~50,000 visual system neurons, performing connectivity analysis, creating 3D neuronal morphology renderings, and building reproducible computational workflows. This dataset was a subset of the full dataset that was released in 2026.
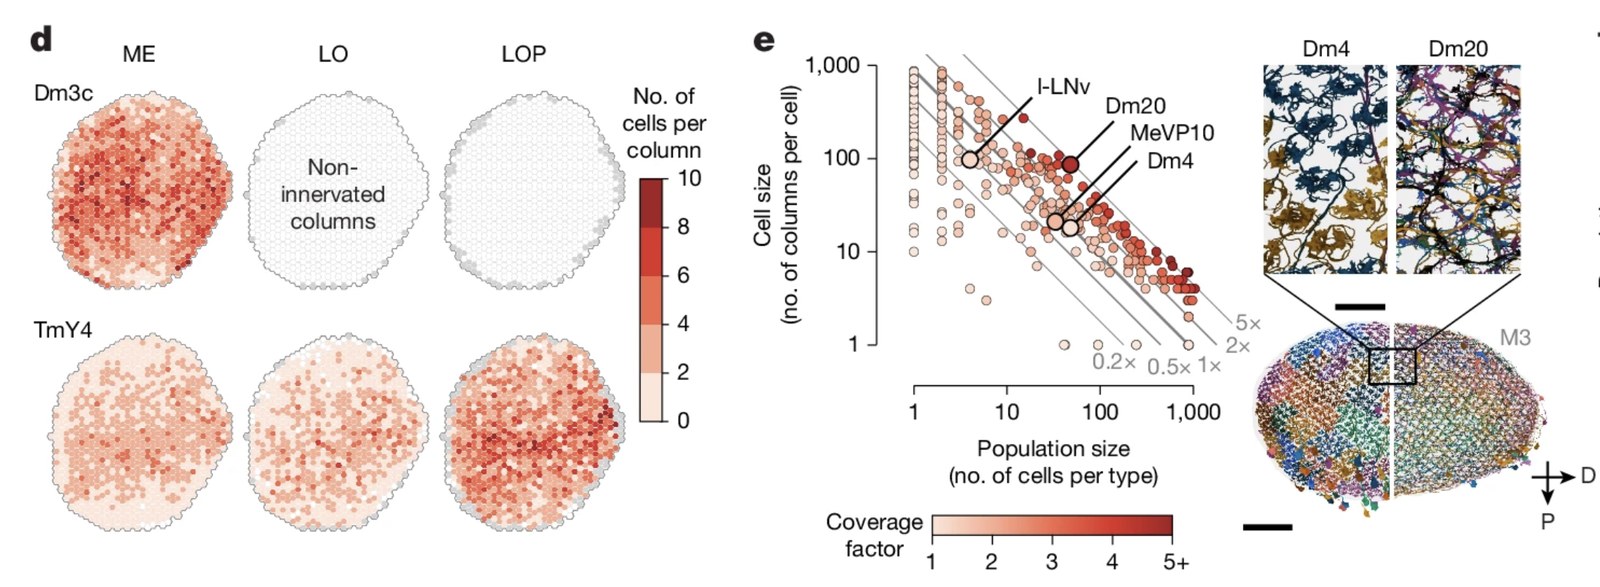
I was specifically involved performing analyses related to the spatial organisation of individual cells and groups of cells in 3D space and their assignment to vertical columns that span the depths of the fruit fly’s visual system and form functionally distinct units.
I was also involved in the first generation of the accompanying web resource (Cell Type Explorer) that we later improved upon with the generation of neuView. We hoped that this web page would provide a more accessible, easy to use resource for researchers investigating the visual system of the fruit fly.
Outcome
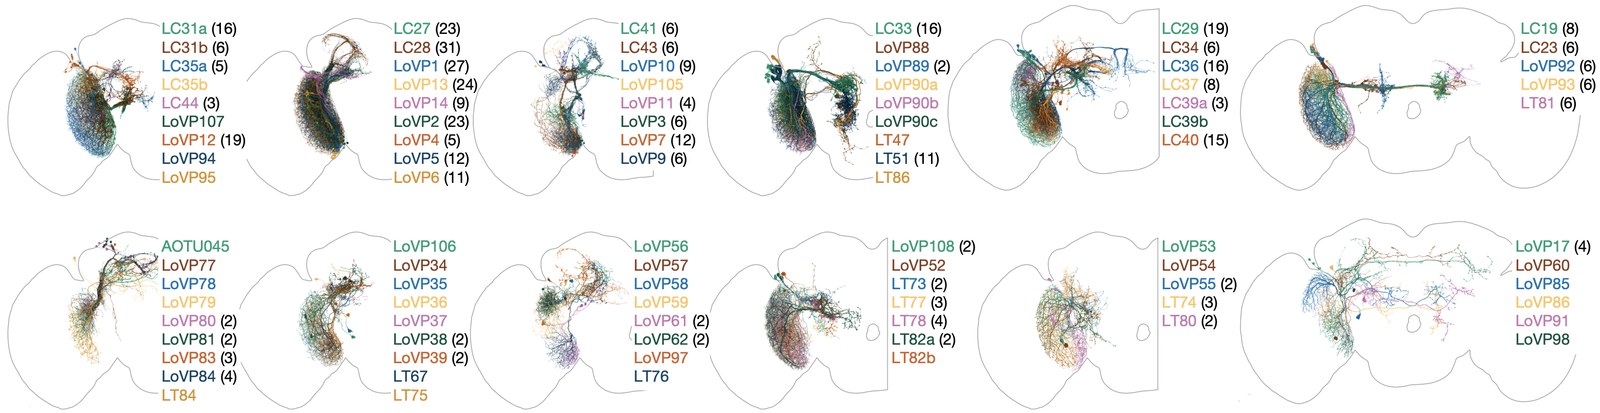
We established a comprehensive inventory of the visual neurons and developed a computational framework to quantify their anatomy. This allowed us to classify ~53,000 neurons into 732 types and forms a basis by which further analysis based on the morphology of cell types might be conducted.
Furthermore, we developed a reproducible analysis pipeline for this large-scale connectomics dataset. The entire analysis workflow was published as supplemental code for Nern et al. 2025, creating what we like to think of as an “executable paper” where every figure and analysis can be independently replicated and reproduced.
Links
- Source Code. This code contains everything needed to reproduce the analyses and to generate the figures in Nern et al. 2025, below.
References
- Nern, A., Loesche, F., Takemura, S., Burnett, L.E., et al. Connectome-driven neural inventory of a complete visual system. Nature 641, 1225–1237 (2025) — the visual system connectome this analysis was published as part of.
- Berg, S., … Burnett, L.E., et al. Sexual dimorphism in the complete connectome of the Drosophila male central nervous system. Cell (2026) — the complete nervous system connectome, not just the visual system.
Acknowledgements
This project took place while I was a member of the Reiser Lab at Howard Hughes Medical Institute (HHMI) Janelia Research Campus. The generation of the male fruit fly connectome was led by the FlyEM team at Janelia.